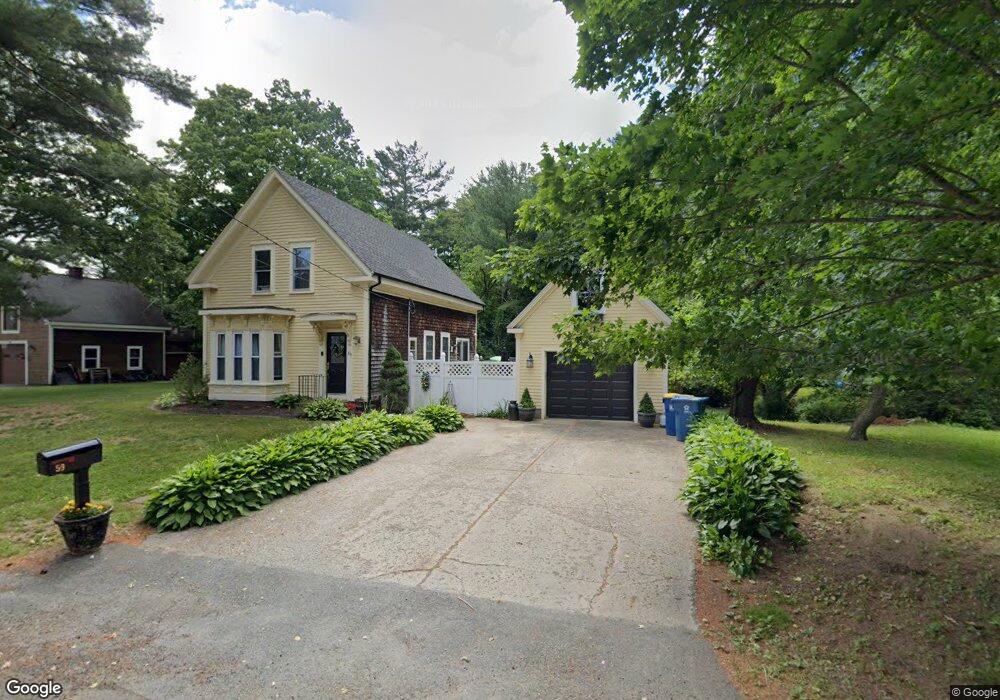
59 Cottage St East Bridgewater, MA 02333
Estimated Value: $483,000 - $622,000
3
Beds
3
Baths
1,670
Sq Ft
$318/Sq Ft
Est. Value
About This Home
This home is located at 59 Cottage St, East Bridgewater, MA 02333 and is currently estimated at $530,680, approximately $317 per square foot. 59 Cottage St is a home located in Plymouth County with nearby schools including Central Elementary School, Gordon W Mitchell Middle School, and East Bridgewater Jr./Sr. High School.
Ownership History
Date
Name
Owned For
Owner Type
Purchase Details
Closed on
Sep 14, 2004
Sold by
Sample Jeffrey L and Dagostino Kristen A
Bought by
Dagostino Kristen A
Current Estimated Value
Purchase Details
Closed on
Jul 1, 1997
Sold by
Getchell Pamela
Bought by
Sample Jeffrey L and Sample Kristen A
Create a Home Valuation Report for This Property
The Home Valuation Report is an in-depth analysis detailing your home's value as well as a comparison with similar homes in the area
Home Values in the Area
Average Home Value in this Area
Purchase History
| Date | Buyer | Sale Price | Title Company |
|---|---|---|---|
| Dagostino Kristen A | $25,000 | -- | |
| Sample Jeffrey L | $113,000 | -- |
Source: Public Records
Mortgage History
| Date | Status | Borrower | Loan Amount |
|---|---|---|---|
| Open | Sample Jeffrey L | $188,000 | |
| Closed | Sample Jeffrey L | $126,000 | |
| Previous Owner | Sample Jeffrey L | $115,186 |
Source: Public Records
Tax History Compared to Growth
Tax History
| Year | Tax Paid | Tax Assessment Tax Assessment Total Assessment is a certain percentage of the fair market value that is determined by local assessors to be the total taxable value of land and additions on the property. | Land | Improvement |
|---|---|---|---|---|
| 2025 | $4,715 | $344,900 | $170,900 | $174,000 |
| 2024 | $4,692 | $339,000 | $164,300 | $174,700 |
| 2023 | $4,664 | $322,800 | $164,300 | $158,500 |
| 2022 | $4,763 | $305,300 | $149,500 | $155,800 |
| 2021 | $18,275 | $282,000 | $143,600 | $138,400 |
| 2020 | $4,815 | $278,500 | $138,100 | $140,400 |
| 2019 | $4,664 | $265,600 | $132,000 | $133,600 |
| 2018 | $4,603 | $256,300 | $132,000 | $124,300 |
| 2017 | $4,505 | $246,200 | $125,900 | $120,300 |
| 2016 | $4,398 | $242,200 | $125,900 | $116,300 |
| 2015 | $4,145 | $233,400 | $125,000 | $108,400 |
| 2014 | $4,047 | $233,000 | $122,400 | $110,600 |
Source: Public Records
Map
Nearby Homes