
Seller's Agent in 2025
Asim Ghani
East Key Realty
(617) 501-6387
62 Total Sales
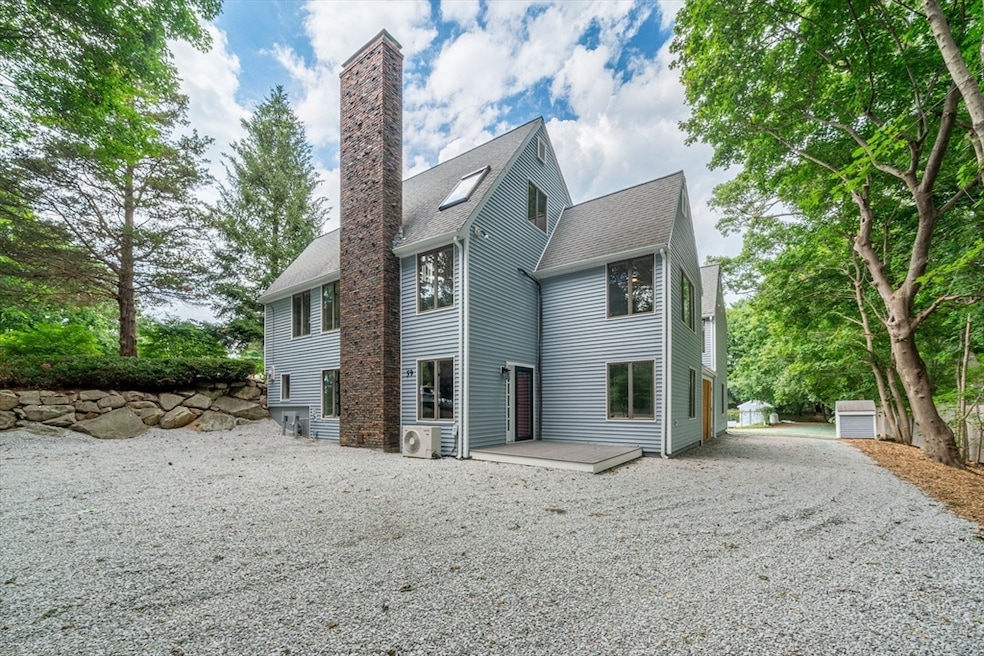
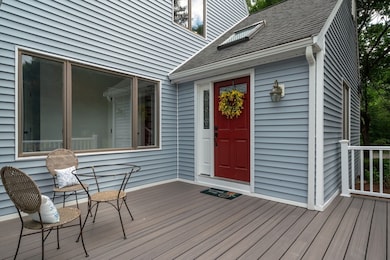
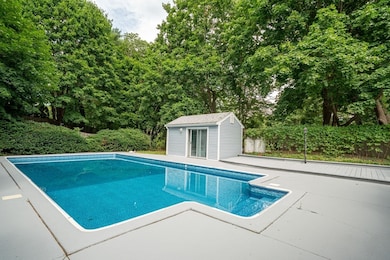


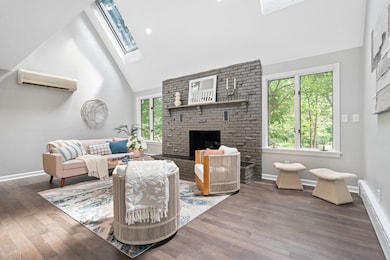
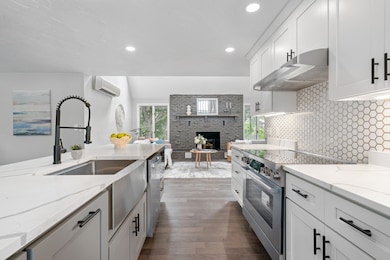
Welcome to this stunning multi-level home that has been completely remodeled from top to bottom offering luxurious modern living with timeless charm. Step inside and fall in love with the all-new gourmet kitchen featuring elegant quartz countertops, stainless steel appliances, custom cabinetry, and a spacious layout perfect for entertaining. The interior boasts gleaming new hardwood floors throughout, beautifully updated bathrooms, and spacious, sun-drenched living areas across multiple levels providing both privacy and flexibility for today’s lifestyle. Outside, enjoy incredible curb appeal with brand-new vinyl siding, professional landscaping, and your own private backyard oasis complete with an in-ground swimming pool ideal for summer gatherings and relaxing weekends.Every detail of this home has been thoughtfully updated, combining style, comfort, and functionality. This is truly a turnkey property with too many upgrades to list. All offers due by 14th July @ 3 pm.
| Date | Type | Sale Price | Title Company |
|---|---|---|---|
| Quit Claim Deed | $1,100,000 | -- | |
| Deed | $1,100,000 | -- | |
| Quit Claim Deed | $855,800 | None Available | |
| Quit Claim Deed | $855,800 | None Available | |
| Quit Claim Deed | $855,800 | None Available | |
| Quit Claim Deed | -- | None Available | |
| Quit Claim Deed | -- | None Available | |
| Quit Claim Deed | -- | None Available | |
| Quit Claim Deed | -- | -- | |
| Quit Claim Deed | -- | -- | |
| Quit Claim Deed | -- | -- | |
| Quit Claim Deed | -- | -- | |
| Quit Claim Deed | -- | -- | |
| Quit Claim Deed | -- | -- |
| Date | Status | Loan Amount | Loan Type |
|---|---|---|---|
| Open | $807,000 | New Conventional | |
| Closed | $807,000 | New Conventional | |
| Previous Owner | $796,545 | Purchase Money Mortgage | |
| Previous Owner | $417,000 | New Conventional |
| Date | Event | Price | List to Sale | Price per Sq Ft |
|---|---|---|---|---|
| 08/12/2025 08/12/25 | Sold | $1,100,000 | +0.9% | $534 / Sq Ft |
| 07/16/2025 07/16/25 | Pending | -- | -- | -- |
| 07/09/2025 07/09/25 | For Sale | $1,090,000 | -- | $529 / Sq Ft |
| Year | Tax Paid | Tax Assessment Tax Assessment Total Assessment is a certain percentage of the fair market value that is determined by local assessors to be the total taxable value of land and additions on the property. | Land | Improvement |
|---|---|---|---|---|
| 2025 | $10,880 | $1,017,800 | $433,000 | $584,800 |
| 2024 | $10,724 | $988,400 | $430,700 | $557,700 |
| 2023 | $9,379 | $937,900 | $430,700 | $507,200 |
| 2022 | $8,773 | $758,900 | $371,500 | $387,400 |
| 2021 | $8,550 | $724,600 | $371,500 | $353,100 |
| 2020 | $8,355 | $724,600 | $371,500 | $353,100 |
| 2019 | $8,558 | $724,600 | $371,500 | $353,100 |
| 2018 | $8,460 | $718,800 | $371,500 | $347,300 |
| 2017 | $7,898 | $644,700 | $358,800 | $285,900 |
| 2016 | $8,002 | $640,700 | $341,600 | $299,100 |
| 2015 | $7,985 | $637,300 | $325,000 | $312,300 |
Seller's Agent in 2025
Asim Ghani
East Key Realty
(617) 501-6387
62 Total Sales
Buyer's Agent in 2025
Ryan Wilson
Keller Williams Realty
(781) 424-6286
660 Total Sales
Source: MLS Property Information Network (MLS PIN)
MLS Number: 73402341
APN: HING-000108-000000-000085
Disclaimer: Certain information contained herein is derived from information provided by parties other than Homes.com. All information provided is deemed reliable, but is not guaranteed to be accurate and should be independently verified.
![]() The property listing data and information, or the Images, set forth herein were provided to MLS Property Information Network, Inc. from third party sources, including sellers, lessors and public records, and were compiled by MLS Property Information Network, Inc. The property listing data and information, and the Images, are for the personal, non-commercial use of consumers having a good faith interest in purchasing or leasing listed properties of the type displayed to them and may not be used for any purpose other than to identify prospective properties which such consumers may have a good faith interest in purchasing or leasing. MLS Property Information Network, Inc. and its subscribers disclaim any and all representations and warranties as to the accuracy of the property listing data and information, or as to the accuracy of any of the Images, set forth herein.
The property listing data and information, or the Images, set forth herein were provided to MLS Property Information Network, Inc. from third party sources, including sellers, lessors and public records, and were compiled by MLS Property Information Network, Inc. The property listing data and information, and the Images, are for the personal, non-commercial use of consumers having a good faith interest in purchasing or leasing listed properties of the type displayed to them and may not be used for any purpose other than to identify prospective properties which such consumers may have a good faith interest in purchasing or leasing. MLS Property Information Network, Inc. and its subscribers disclaim any and all representations and warranties as to the accuracy of the property listing data and information, or as to the accuracy of any of the Images, set forth herein.
Ask me questions while you tour the home.