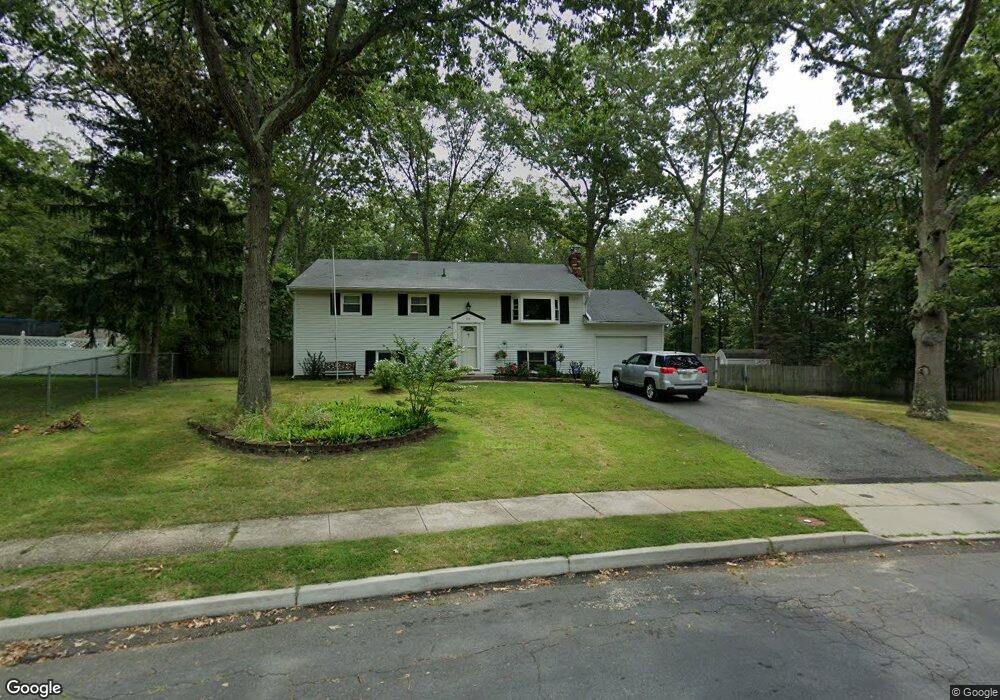
59 Darien Rd Howell, NJ 07731
Salem Hill NeighborhoodEstimated Value: $622,000 - $708,673
4
Beds
2
Baths
2,000
Sq Ft
$333/Sq Ft
Est. Value
About This Home
This home is located at 59 Darien Rd, Howell, NJ 07731 and is currently estimated at $666,918, approximately $333 per square foot. 59 Darien Rd is a home located in Monmouth County with nearby schools including Land O' Pines School, Newbury School, and Howell Middle School North.
Ownership History
Date
Name
Owned For
Owner Type
Purchase Details
Closed on
Jun 11, 2010
Sold by
Brunson Burley and Brunson Emma
Bought by
Brunson Emma
Current Estimated Value
Home Financials for this Owner
Home Financials are based on the most recent Mortgage that was taken out on this home.
Original Mortgage
$352,302
Interest Rate
5.5%
Mortgage Type
FHA
Create a Home Valuation Report for This Property
The Home Valuation Report is an in-depth analysis detailing your home's value as well as a comparison with similar homes in the area
Home Values in the Area
Average Home Value in this Area
Purchase History
| Date | Buyer | Sale Price | Title Company |
|---|---|---|---|
| Brunson Emma | -- | None Available |
Source: Public Records
Mortgage History
| Date | Status | Borrower | Loan Amount |
|---|---|---|---|
| Closed | Brunson Emma | $352,302 |
Source: Public Records
Tax History Compared to Growth
Tax History
| Year | Tax Paid | Tax Assessment Tax Assessment Total Assessment is a certain percentage of the fair market value that is determined by local assessors to be the total taxable value of land and additions on the property. | Land | Improvement |
|---|---|---|---|---|
| 2025 | $10,501 | $655,300 | $400,500 | $254,800 |
| 2024 | $9,951 | $590,600 | $340,500 | $250,100 |
| 2023 | $9,951 | $534,700 | $290,500 | $244,200 |
| 2022 | $9,698 | $460,100 | $227,500 | $232,600 |
| 2021 | $9,698 | $422,400 | $215,500 | $206,900 |
| 2020 | $9,204 | $396,400 | $193,000 | $203,400 |
| 2019 | $9,078 | $383,700 | $183,800 | $199,900 |
| 2018 | $8,695 | $365,200 | $174,600 | $190,600 |
| 2017 | $8,979 | $372,900 | $173,000 | $199,900 |
| 2016 | $8,583 | $352,900 | $158,000 | $194,900 |
| 2015 | $8,720 | $354,900 | $165,100 | $189,800 |
| 2014 | $8,717 | $329,200 | $178,300 | $150,900 |
Source: Public Records
Map
Nearby Homes
- 24 Sun Hollow Rd
- 4 Rainbow Dr
- 22 Diamond Ln
- 43 Darien Rd
- 9 Yellowstone Ln
- 1 Sun Hollow Rd
- 66 Diamond Ln
- 3 Diamond Ln
- 47 Yellowstone Ln
- 131 Starlight Rd
- 44 Diamond Ln
- 254 Aldrich Rd
- 7 Cherry Bend Dr
- 21 Christopher Dr
- 28 Princeton Dr
- 324 Aldrich Rd
- 20 Nottingham Dr
- 19 Kensington Dr
- 28 Salem Hill Rd
- 3 Brent Dr
- 61 Darien Rd
- 57 Darien Rd
- 54 Darien Rd
- 63 Darien Rd
- 55 Darien Rd
- 19 Northgate Dr
- 26 Sun Hollow Rd
- 28 Sun Hollow Rd
- 52 Darien Rd
- 65 Darien Rd
- 22 Sun Hollow Rd
- 30 Sun Hollow Rd
- 32 Sun Hollow Rd
- 17 Northgate Dr
- 20 Sun Hollow Rd
- 67 Darien Rd
- 34 Sun Hollow Rd
- 18 Sun Hollow Rd
- 51 Darien Rd
- 20 Northgate Dr