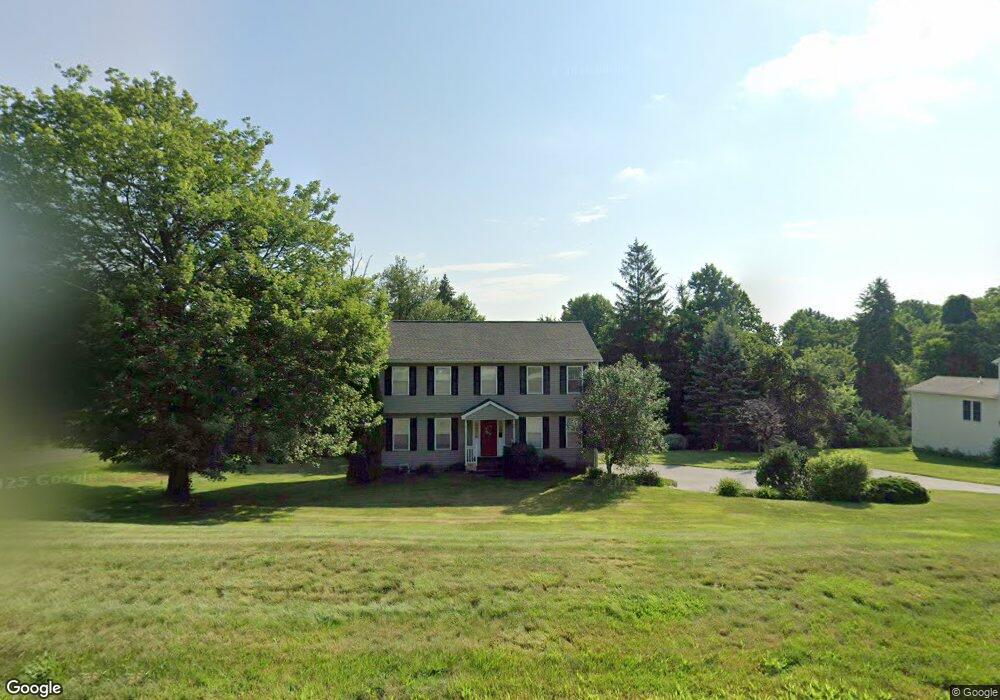
59 Davis Rd Seymour, CT 06483
Estimated Value: $549,000 - $645,000
3
Beds
3
Baths
2,014
Sq Ft
$286/Sq Ft
Est. Value
About This Home
This home is located at 59 Davis Rd, Seymour, CT 06483 and is currently estimated at $576,983, approximately $286 per square foot. 59 Davis Rd is a home located in New Haven County with nearby schools including Bungay Elementary School, Seymour Middle School, and Seymour High School.
Ownership History
Date
Name
Owned For
Owner Type
Purchase Details
Closed on
Mar 9, 2021
Sold by
L B
Bought by
Hardman Barrett L and Hardman Kathleen M
Current Estimated Value
Purchase Details
Closed on
Jun 12, 2019
Sold by
Hardman Barrett and Hardman Kathleen
Bought by
Barrett & K Hardman Lt
Home Financials for this Owner
Home Financials are based on the most recent Mortgage that was taken out on this home.
Original Mortgage
$64,000
Interest Rate
4.4%
Mortgage Type
Stand Alone Refi Refinance Of Original Loan
Purchase Details
Closed on
Jan 28, 1997
Sold by
Seymour Park Inc
Bought by
Hardman Barrett L and Hardman Kathleen M
Create a Home Valuation Report for This Property
The Home Valuation Report is an in-depth analysis detailing your home's value as well as a comparison with similar homes in the area
Home Values in the Area
Average Home Value in this Area
Purchase History
| Date | Buyer | Sale Price | Title Company |
|---|---|---|---|
| Hardman Barrett L | -- | None Available | |
| Hardman Barrett L | -- | None Available | |
| Barrett & K Hardman Lt | -- | -- | |
| Hardman Barrett L | $189,000 | -- | |
| Barrett & K Hardman Lt | -- | -- | |
| Hardman Barrett L | $189,000 | -- |
Source: Public Records
Mortgage History
| Date | Status | Borrower | Loan Amount |
|---|---|---|---|
| Previous Owner | Hardman Barrett L | $64,000 | |
| Previous Owner | Hardman Barrett L | $93,000 | |
| Previous Owner | Hardman Barrett L | $32,000 |
Source: Public Records
Tax History Compared to Growth
Tax History
| Year | Tax Paid | Tax Assessment Tax Assessment Total Assessment is a certain percentage of the fair market value that is determined by local assessors to be the total taxable value of land and additions on the property. | Land | Improvement |
|---|---|---|---|---|
| 2025 | $8,644 | $311,850 | $53,900 | $257,950 |
| 2024 | $8,159 | $221,480 | $54,320 | $167,160 |
| 2023 | $7,969 | $221,480 | $54,320 | $167,160 |
| 2022 | $7,882 | $221,480 | $54,320 | $167,160 |
| 2021 | $7,688 | $221,480 | $54,320 | $167,160 |
| 2020 | $7,303 | $202,860 | $63,840 | $139,020 |
| 2019 | $7,303 | $202,860 | $63,840 | $139,020 |
| 2018 | $7,303 | $202,860 | $63,840 | $139,020 |
| 2017 | $7,303 | $202,860 | $63,840 | $139,020 |
| 2016 | $7,303 | $202,860 | $63,840 | $139,020 |
| 2015 | $7,438 | $215,040 | $70,000 | $145,040 |
| 2014 | $7,320 | $215,040 | $70,000 | $145,040 |
Source: Public Records
Map
Nearby Homes