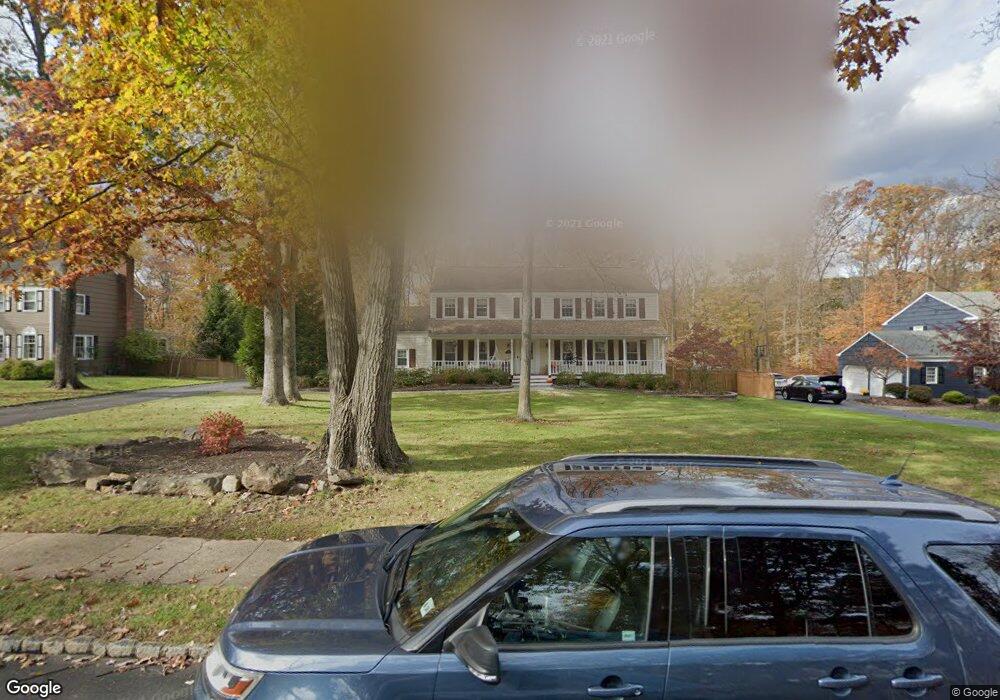
59 Dean Rd Mendham, NJ 07945
Estimated Value: $989,017 - $1,305,000
Studio
--
Bath
2,551
Sq Ft
$446/Sq Ft
Est. Value
About This Home
This home is located at 59 Dean Rd, Mendham, NJ 07945 and is currently estimated at $1,136,504, approximately $445 per square foot. 59 Dean Rd is a home located in Morris County with nearby schools including Hilltop Elementary School, Mountain View Middle School, and West Morris Mendham High School.
Ownership History
Date
Name
Owned For
Owner Type
Purchase Details
Closed on
Oct 22, 2010
Sold by
Turner Robert H
Bought by
Kay Keith W and Kay Jennifer L
Current Estimated Value
Home Financials for this Owner
Home Financials are based on the most recent Mortgage that was taken out on this home.
Original Mortgage
$414,000
Outstanding Balance
$272,682
Interest Rate
4.39%
Mortgage Type
New Conventional
Estimated Equity
$863,822
Create a Home Valuation Report for This Property
The Home Valuation Report is an in-depth analysis detailing your home's value as well as a comparison with similar homes in the area
Home Values in the Area
Average Home Value in this Area
Purchase History
| Date | Buyer | Sale Price | Title Company |
|---|---|---|---|
| Kay Keith W | $725,000 | Multiple |
Source: Public Records
Mortgage History
| Date | Status | Borrower | Loan Amount |
|---|---|---|---|
| Open | Kay Keith W | $414,000 |
Source: Public Records
Tax History
| Year | Tax Paid | Tax Assessment Tax Assessment Total Assessment is a certain percentage of the fair market value that is determined by local assessors to be the total taxable value of land and additions on the property. | Land | Improvement |
|---|---|---|---|---|
| 2025 | $16,967 | $689,700 | $348,500 | $341,200 |
| 2024 | $16,925 | $689,700 | $348,500 | $341,200 |
| 2023 | $16,925 | $689,700 | $348,500 | $341,200 |
| 2022 | $16,153 | $689,700 | $348,500 | $341,200 |
| 2021 | $16,153 | $689,700 | $348,500 | $341,200 |
| 2020 | $15,870 | $689,700 | $348,500 | $341,200 |
| 2019 | $15,498 | $689,700 | $348,500 | $341,200 |
| 2018 | $15,277 | $689,700 | $348,500 | $341,200 |
| 2017 | $15,056 | $689,700 | $348,500 | $341,200 |
| 2016 | $14,601 | $689,700 | $348,500 | $341,200 |
| 2015 | $14,277 | $689,700 | $348,500 | $341,200 |
| 2014 | $13,904 | $689,700 | $348,500 | $341,200 |
Source: Public Records
Map
Nearby Homes
Your Personal Tour Guide
Ask me questions while you tour the home.