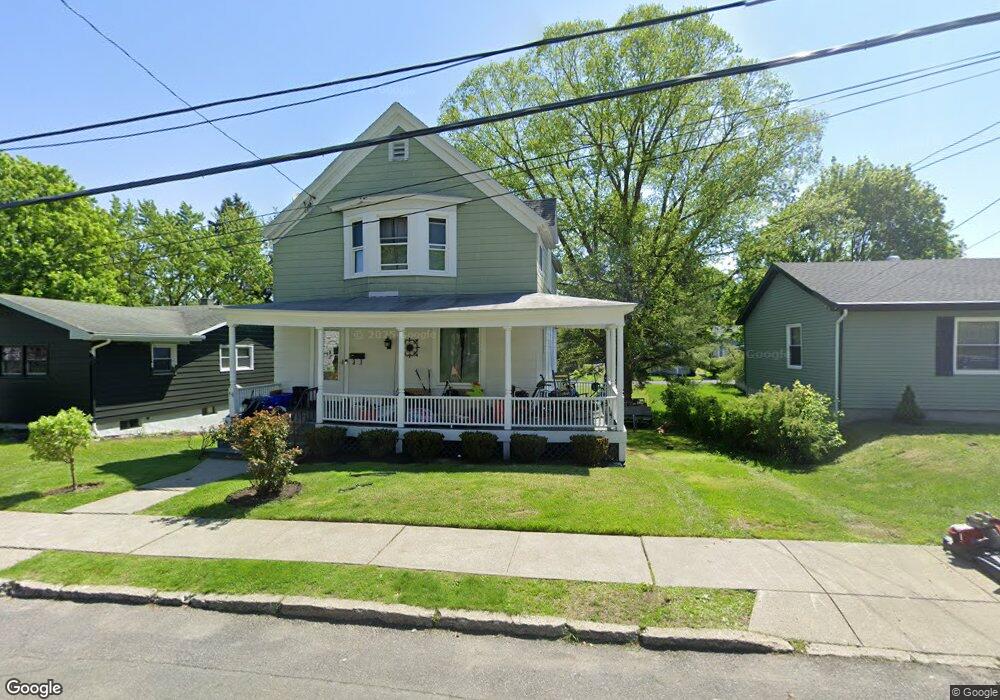
59 Desson Ave Troy, NY 12180
Eastside Troy NeighborhoodEstimated Value: $234,000 - $266,000
3
Beds
1
Bath
1,300
Sq Ft
$189/Sq Ft
Est. Value
About This Home
This home is located at 59 Desson Ave, Troy, NY 12180 and is currently estimated at $245,673, approximately $188 per square foot. 59 Desson Ave is a home located in Rensselaer County with nearby schools including P.S. 16, Troy Middle School, and Troy High School.
Ownership History
Date
Name
Owned For
Owner Type
Purchase Details
Closed on
Jan 27, 2021
Sold by
Driscoll Colleen
Bought by
Sandberg Kaitlyn M and Dobert Stephen J
Current Estimated Value
Home Financials for this Owner
Home Financials are based on the most recent Mortgage that was taken out on this home.
Original Mortgage
$114,880
Outstanding Balance
$102,748
Interest Rate
2.7%
Mortgage Type
FHA
Estimated Equity
$142,925
Purchase Details
Closed on
Oct 30, 2015
Sold by
Mccartney Family Trust Lois
Bought by
Driscoll Colleen
Home Financials for this Owner
Home Financials are based on the most recent Mortgage that was taken out on this home.
Original Mortgage
$112,917
Interest Rate
3.88%
Mortgage Type
FHA
Purchase Details
Closed on
Dec 20, 1996
Create a Home Valuation Report for This Property
The Home Valuation Report is an in-depth analysis detailing your home's value as well as a comparison with similar homes in the area
Home Values in the Area
Average Home Value in this Area
Purchase History
| Date | Buyer | Sale Price | Title Company |
|---|---|---|---|
| Sandberg Kaitlyn M | $117,000 | None Available | |
| Driscoll Colleen | $115,000 | Stephanie Henry | |
| -- | -- | -- |
Source: Public Records
Mortgage History
| Date | Status | Borrower | Loan Amount |
|---|---|---|---|
| Open | Sandberg Kaitlyn M | $114,880 | |
| Previous Owner | Driscoll Colleen | $112,917 |
Source: Public Records
Tax History
| Year | Tax Paid | Tax Assessment Tax Assessment Total Assessment is a certain percentage of the fair market value that is determined by local assessors to be the total taxable value of land and additions on the property. | Land | Improvement |
|---|---|---|---|---|
| 2024 | $8,128 | $143,000 | $13,000 | $130,000 |
| 2023 | $8,701 | $143,000 | $13,000 | $130,000 |
| 2022 | $6,536 | $143,000 | $13,000 | $130,000 |
| 2021 | $1,686 | $143,000 | $13,000 | $130,000 |
| 2020 | $3,293 | $143,000 | $13,000 | $130,000 |
| 2019 | $4,677 | $143,000 | $13,000 | $130,000 |
| 2018 | $4,677 | $143,000 | $13,000 | $130,000 |
| 2017 | $4,656 | $143,000 | $13,000 | $130,000 |
| 2016 | $6,154 | $143,000 | $13,000 | $130,000 |
| 2015 | -- | $143,000 | $13,000 | $130,000 |
| 2014 | -- | $143,000 | $13,000 | $130,000 |
Source: Public Records
Map
Nearby Homes
- 35 Excelsior Ave
- 36 Kinloch Ave Unit 38
- 456 Pawling Ave
- 12 Parkview Ct
- 4 Plum Ave
- 10 Jesse Ct
- 12 Woodlawn Ct
- 26 Woodlawn Ct
- 30 Griswold Ave
- 116 Maple Ave
- 16 Billings Ave
- 14 Lilac Ln
- 124 Mountainview Ave
- 58 Wynantskill Way
- 7 Collins Ave
- 86 Pinewoods Ave
- 37 Hamilton Ave
- 0 Cole Ln Unit 202032172
- 79 Cole Ln
- 40 Brunswick Rd
Your Personal Tour Guide
Ask me questions while you tour the home.