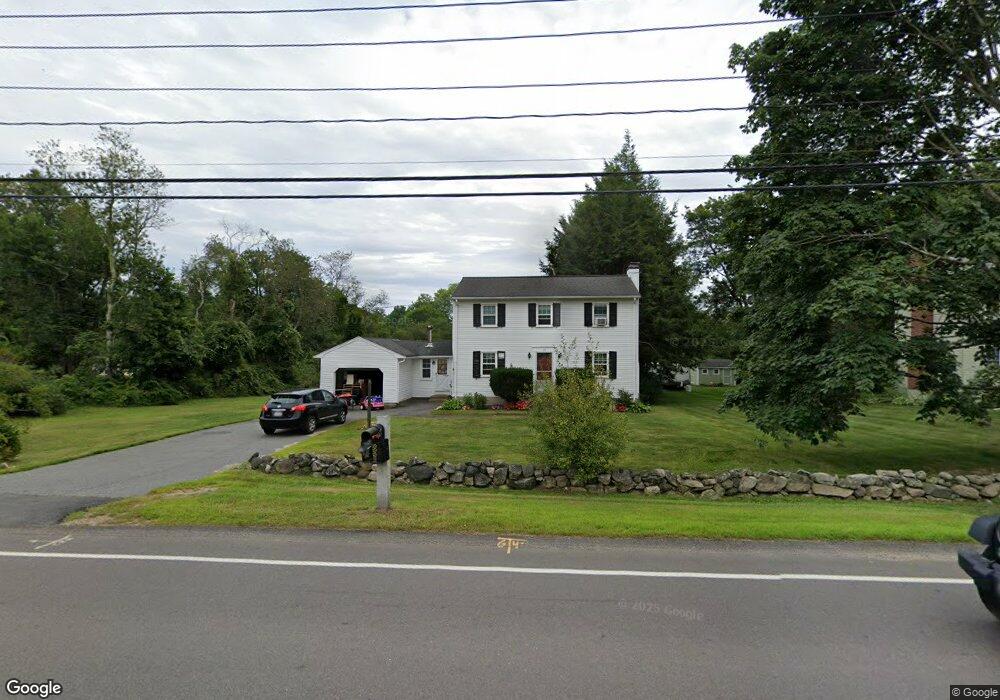
59 Dover Rd Millis, MA 02054
Estimated Value: $544,000 - $642,698
4
Beds
2
Baths
1,856
Sq Ft
$329/Sq Ft
Est. Value
About This Home
This home is located at 59 Dover Rd, Millis, MA 02054 and is currently estimated at $610,925, approximately $329 per square foot. 59 Dover Rd is a home located in Norfolk County with nearby schools including Clyde F Brown, Millis Middle School, and Millis High School.
Ownership History
Date
Name
Owned For
Owner Type
Purchase Details
Closed on
Aug 29, 2025
Sold by
R & I Llc
Bought by
Hunt David C and Hunt Natalie J
Current Estimated Value
Home Financials for this Owner
Home Financials are based on the most recent Mortgage that was taken out on this home.
Original Mortgage
$195,000
Outstanding Balance
$194,661
Interest Rate
6.72%
Mortgage Type
New Conventional
Estimated Equity
$416,264
Purchase Details
Closed on
Oct 10, 2007
Sold by
Hunt David C and Hunt Natalie J
Bought by
R & I Llc
Create a Home Valuation Report for This Property
The Home Valuation Report is an in-depth analysis detailing your home's value as well as a comparison with similar homes in the area
Home Values in the Area
Average Home Value in this Area
Purchase History
| Date | Buyer | Sale Price | Title Company |
|---|---|---|---|
| Hunt David C | $195,000 | Equity National Title | |
| R & I Llc | -- | -- | |
| R&I Llc | -- | -- |
Source: Public Records
Mortgage History
| Date | Status | Borrower | Loan Amount |
|---|---|---|---|
| Open | Hunt David C | $195,000 | |
| Previous Owner | R & I Llc | $100,000 | |
| Previous Owner | R & I Llc | $140,000 |
Source: Public Records
Tax History
| Year | Tax Paid | Tax Assessment Tax Assessment Total Assessment is a certain percentage of the fair market value that is determined by local assessors to be the total taxable value of land and additions on the property. | Land | Improvement |
|---|---|---|---|---|
| 2025 | $8,305 | $506,400 | $190,800 | $315,600 |
| 2024 | $8,005 | $487,500 | $190,800 | $296,700 |
| 2023 | $7,926 | $453,200 | $165,900 | $287,300 |
| 2022 | $7,737 | $409,800 | $165,900 | $243,900 |
| 2021 | $7,613 | $388,000 | $165,900 | $222,100 |
| 2020 | $7,434 | $369,100 | $155,100 | $214,000 |
| 2019 | $6,625 | $354,300 | $146,400 | $207,900 |
| 2018 | $6,145 | $341,000 | $133,100 | $207,900 |
| 2017 | $6,128 | $332,700 | $144,400 | $188,300 |
| 2016 | $5,802 | $332,700 | $144,400 | $188,300 |
| 2015 | $5,656 | $332,700 | $144,400 | $188,300 |
Source: Public Records
Map
Nearby Homes
Your Personal Tour Guide
Ask me questions while you tour the home.