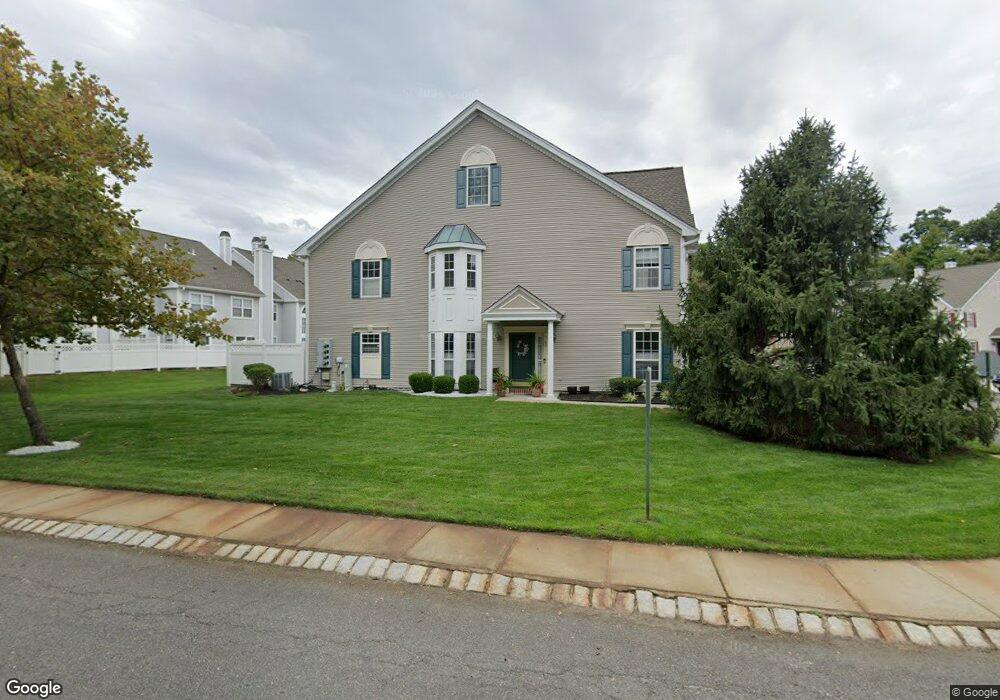
59 Durant Ave Unit 320 Holmdel, NJ 07733
Estimated Value: $687,000 - $712,000
3
Beds
3
Baths
1,961
Sq Ft
$356/Sq Ft
Est. Value
About This Home
This home is located at 59 Durant Ave Unit 320, Holmdel, NJ 07733 and is currently estimated at $698,394, approximately $356 per square foot. 59 Durant Ave Unit 320 is a home located in Monmouth County with nearby schools including Village School, Indian Hill Elementary School, and William Satz Intermediate School.
Ownership History
Date
Name
Owned For
Owner Type
Purchase Details
Closed on
Mar 15, 2023
Sold by
Ulu Srinath Dontula Sriram and Ulu Sandya
Bought by
Iyer Anjali
Current Estimated Value
Purchase Details
Closed on
Jul 22, 2015
Sold by
Cheng Huey Lin
Bought by
Sandya Ulu Srinath Dontula Sriram and Sandya Madonala
Home Financials for this Owner
Home Financials are based on the most recent Mortgage that was taken out on this home.
Original Mortgage
$365,000
Interest Rate
4.01%
Mortgage Type
New Conventional
Purchase Details
Closed on
Jun 30, 2010
Sold by
Guzman Richard L and Guzman Mildred A
Bought by
Cheng Huey Lin
Home Financials for this Owner
Home Financials are based on the most recent Mortgage that was taken out on this home.
Original Mortgage
$277,000
Interest Rate
4.82%
Mortgage Type
New Conventional
Create a Home Valuation Report for This Property
The Home Valuation Report is an in-depth analysis detailing your home's value as well as a comparison with similar homes in the area
Home Values in the Area
Average Home Value in this Area
Purchase History
| Date | Buyer | Sale Price | Title Company |
|---|---|---|---|
| Iyer Anjali | $610,000 | Fidelity National Title | |
| Iyer Anjali | $610,000 | Fidelity National Title | |
| Sandya Ulu Srinath Dontula Sriram | $435,000 | Title Agency Inc | |
| Cheng Huey Lin | $370,000 | New Jersey Title Ins Company |
Source: Public Records
Mortgage History
| Date | Status | Borrower | Loan Amount |
|---|---|---|---|
| Previous Owner | Sandya Ulu Srinath Dontula Sriram | $365,000 | |
| Previous Owner | Cheng Huey Lin | $277,000 |
Source: Public Records
Tax History Compared to Growth
Tax History
| Year | Tax Paid | Tax Assessment Tax Assessment Total Assessment is a certain percentage of the fair market value that is determined by local assessors to be the total taxable value of land and additions on the property. | Land | Improvement |
|---|---|---|---|---|
| 2025 | $9,262 | $644,000 | $355,000 | $289,000 |
| 2024 | $8,854 | $587,700 | $325,000 | $262,700 |
| 2023 | $8,854 | $544,200 | $295,000 | $249,200 |
| 2022 | $8,953 | $489,800 | $285,000 | $204,800 |
| 2021 | $8,953 | $446,300 | $250,000 | $196,300 |
| 2020 | $8,908 | $436,900 | $240,000 | $196,900 |
| 2019 | $9,033 | $445,200 | $230,000 | $215,200 |
| 2018 | $8,640 | $427,500 | $200,000 | $227,500 |
| 2017 | $8,067 | $397,600 | $183,000 | $214,600 |
| 2016 | $8,042 | $400,900 | $180,000 | $220,900 |
| 2015 | $7,546 | $377,500 | $160,000 | $217,500 |
| 2014 | $7,093 | $339,400 | $170,000 | $169,400 |
Source: Public Records
Map
Nearby Homes
- 58 Agostina Dr Unit 250
- 8 Stagecoach Dr Unit 13
- 64 Agostina Dr Unit 64
- 4 Pine Tree Terrace
- 22 Weller Place Unit 22
- 32 Bristel Rd Unit 212
- 901 Palmer Ave
- 64 Hawthorne Ave
- 846 Palmer Ave
- 6 Ridge Dr
- 343 Middlewood Rd
- 8 Leocadia Ct
- 27 Gibson Dr
- 9 Borick Ave
- 35 Violet Ct
- 7 John St
- 3 John St Unit 118
- 1305 Arose Ln
- 17 Avenue D
- 22 Avenue D Unit 45
- 59 Durant Ave Unit A
- 58 Durant Ave
- 57 Durant Ave Unit 33C
- 56 Durant Ave
- 56 Durant Ave Unit 323
- 55 Durant Ave
- 3 Oxford Rd
- 4 Oxford Rd
- 4 Oxford Rd Unit 329
- 2 Oxford Rd
- 2 Oxford Rd Unit 327
- 54 Durant Ave
- 61 Durant Ave
- 60 Durant Ave
- 60 Durant Ave Unit 114
- 63 Durant Ave Unit 32C2
- 62 Durant Ave
- 65 Durant Ave
- 64 Durant Ave
- 67 Durant Ave