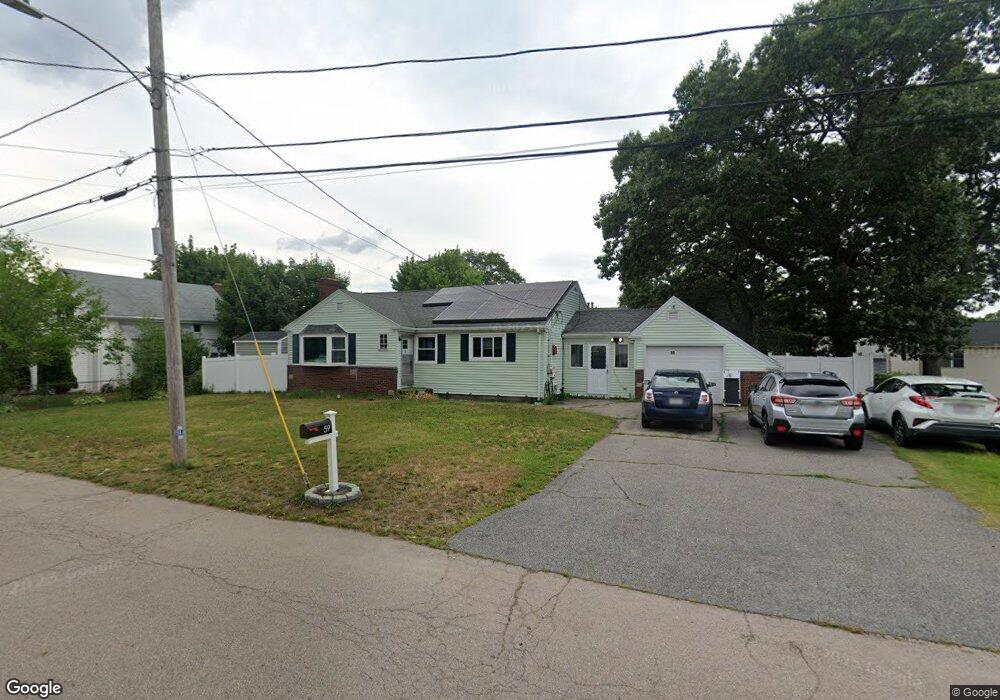
59 E Bacon St Attleboro, MA 02703
Estimated Value: $464,000 - $491,000
2
Beds
1
Bath
1,293
Sq Ft
$372/Sq Ft
Est. Value
About This Home
This home is located at 59 E Bacon St, Attleboro, MA 02703 and is currently estimated at $481,022, approximately $372 per square foot. 59 E Bacon St is a home located in Bristol County with nearby schools including Hill-Roberts Elementary School, Robert J. Coelho Middle School, and Attleboro High School.
Ownership History
Date
Name
Owned For
Owner Type
Purchase Details
Closed on
May 21, 1999
Sold by
Guimond Douglas M and Guimond Cheryl A
Bought by
Lacsamana Edward K and Lacsamana Cecilia M
Current Estimated Value
Home Financials for this Owner
Home Financials are based on the most recent Mortgage that was taken out on this home.
Original Mortgage
$125,936
Outstanding Balance
$32,109
Interest Rate
6.88%
Mortgage Type
Purchase Money Mortgage
Estimated Equity
$448,913
Purchase Details
Closed on
May 22, 1989
Sold by
Antunes Richard A
Bought by
Guimond Douglas M
Home Financials for this Owner
Home Financials are based on the most recent Mortgage that was taken out on this home.
Original Mortgage
$108,000
Interest Rate
10.97%
Mortgage Type
Purchase Money Mortgage
Create a Home Valuation Report for This Property
The Home Valuation Report is an in-depth analysis detailing your home's value as well as a comparison with similar homes in the area
Home Values in the Area
Average Home Value in this Area
Purchase History
| Date | Buyer | Sale Price | Title Company |
|---|---|---|---|
| Lacsamana Edward K | $63,000 | -- | |
| Guimond Douglas M | $120,000 | -- |
Source: Public Records
Mortgage History
| Date | Status | Borrower | Loan Amount |
|---|---|---|---|
| Open | Guimond Douglas M | $125,936 | |
| Previous Owner | Guimond Douglas M | $102,600 | |
| Previous Owner | Guimond Douglas M | $108,000 |
Source: Public Records
Tax History
| Year | Tax Paid | Tax Assessment Tax Assessment Total Assessment is a certain percentage of the fair market value that is determined by local assessors to be the total taxable value of land and additions on the property. | Land | Improvement |
|---|---|---|---|---|
| 2025 | $5,164 | $411,500 | $129,500 | $282,000 |
| 2024 | $4,965 | $390,000 | $129,500 | $260,500 |
| 2023 | $4,677 | $341,600 | $117,700 | $223,900 |
| 2022 | $4,465 | $309,000 | $112,100 | $196,900 |
| 2021 | $4,095 | $276,700 | $107,800 | $168,900 |
| 2020 | $3,978 | $273,200 | $104,700 | $168,500 |
| 2019 | $3,795 | $268,000 | $102,700 | $165,300 |
| 2018 | $3,692 | $249,100 | $99,700 | $149,400 |
| 2017 | $2,884 | $198,200 | $99,700 | $98,500 |
| 2016 | $2,751 | $185,600 | $97,900 | $87,700 |
| 2015 | $2,751 | $187,000 | $97,900 | $89,100 |
| 2014 | $2,571 | $173,100 | $93,200 | $79,900 |
Source: Public Records
Map
Nearby Homes
- 79 Turner St
- 37 Turner St
- 61 Mendon Rd
- 386 Mendon Ave
- 18 Newton St
- 50 Pullman Ave Unit A
- 50 Pullman Ave Unit B
- 67 Norton St
- 58 Baltic St Unit 58
- 56 Baltic St Unit 56
- 54 Baltic St Unit 54
- 52 Baltic St Unit 52
- 91 Greenwich St
- 179 Columbine Ave
- 735 Broadway
- 27 Collins Ave
- 215 Kenyon Ave
- 39 John St
- 362 Kenyon Ave
- 39 Webster St Unit 204
Your Personal Tour Guide
Ask me questions while you tour the home.