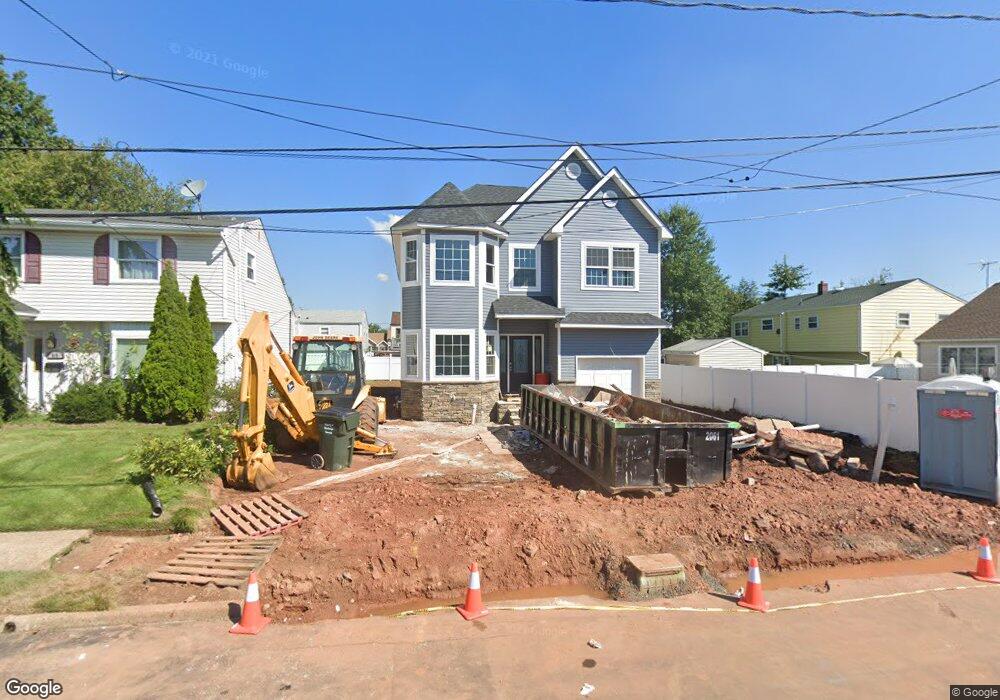
59 E Laurel St Port Reading, NJ 07064
Estimated Value: $501,179 - $774,000
Studio
--
Bath
2,336
Sq Ft
$291/Sq Ft
Est. Value
About This Home
This home is located at 59 E Laurel St, Port Reading, NJ 07064 and is currently estimated at $678,795, approximately $290 per square foot. 59 E Laurel St is a home located in Middlesex County with nearby schools including Carteret High School and St Joseph School.
Ownership History
Date
Name
Owned For
Owner Type
Purchase Details
Closed on
Dec 12, 2018
Sold by
South Pine Llc
Bought by
Shipper Janice and Shipper Christopher
Current Estimated Value
Home Financials for this Owner
Home Financials are based on the most recent Mortgage that was taken out on this home.
Original Mortgage
$343,920
Outstanding Balance
$303,606
Interest Rate
4.9%
Mortgage Type
New Conventional
Estimated Equity
$375,189
Purchase Details
Closed on
Jan 21, 2016
Sold by
Chaberlain Megan
Bought by
South Pine Llc
Create a Home Valuation Report for This Property
The Home Valuation Report is an in-depth analysis detailing your home's value as well as a comparison with similar homes in the area
Home Values in the Area
Average Home Value in this Area
Purchase History
| Date | Buyer | Sale Price | Title Company |
|---|---|---|---|
| Shipper Janice | $429,900 | None Available | |
| South Pine Llc | $100,000 | None Available |
Source: Public Records
Mortgage History
| Date | Status | Borrower | Loan Amount |
|---|---|---|---|
| Open | Shipper Janice | $343,920 |
Source: Public Records
Tax History
| Year | Tax Paid | Tax Assessment Tax Assessment Total Assessment is a certain percentage of the fair market value that is determined by local assessors to be the total taxable value of land and additions on the property. | Land | Improvement |
|---|---|---|---|---|
| 2025 | $15,162 | $113,800 | $18,000 | $95,800 |
| 2024 | $14,720 | $113,800 | $18,000 | $95,800 |
Source: Public Records
Map
Nearby Homes
Your Personal Tour Guide
Ask me questions while you tour the home.