Estimated Value: $329,368 - $347,000
3
Beds
2
Baths
1,484
Sq Ft
$228/Sq Ft
Est. Value
About This Home
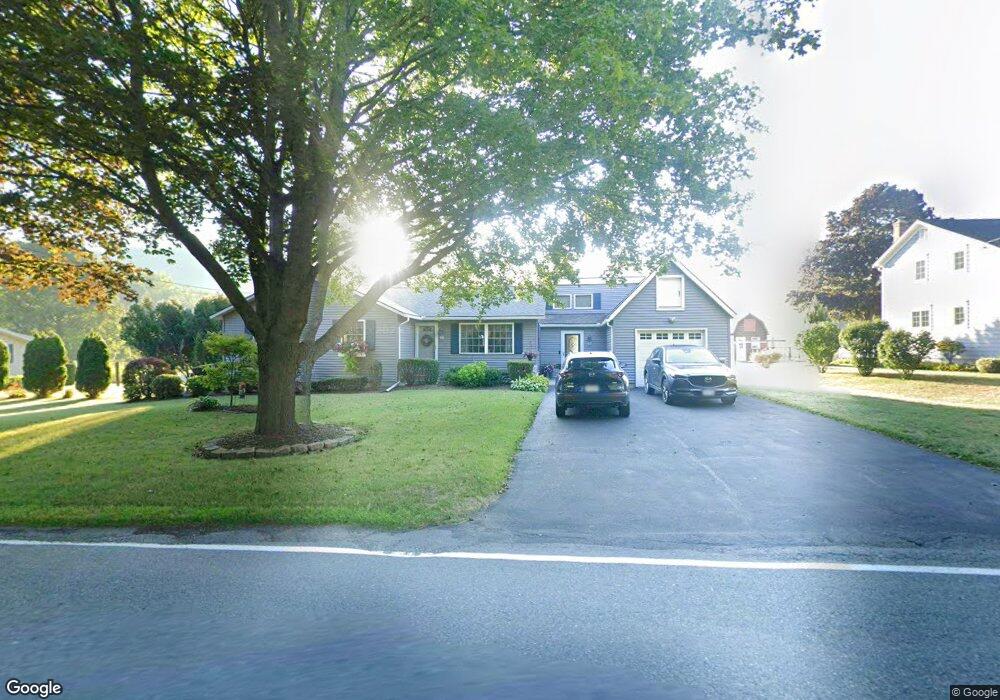
This home is located at 59 East Rd, Adams, MA 01220 and is currently estimated at $338,092, approximately $227 per square foot. 59 East Rd is a home located in Berkshire County with nearby schools including Hoosac Valley Middle & High School and Berkshire Arts & Technology Charter Public School.
Ownership History
Date
Name
Owned For
Owner Type
Purchase Details
Closed on
Feb 13, 2023
Sold by
Dzierga Andrew S and Dzierga Elizabeth J
Bought by
Thomas Jessica and Dzierga Jennifer
Current Estimated Value
Purchase Details
Closed on
Sep 30, 1980
Bought by
Dzierga Andrew and Dzierga Elizabeth J
Create a Home Valuation Report for This Property
The Home Valuation Report is an in-depth analysis detailing your home's value as well as a comparison with similar homes in the area
Home Values in the Area
Average Home Value in this Area
Purchase History
| Date | Buyer | Sale Price | Title Company |
|---|---|---|---|
| Thomas Jessica | -- | None Available | |
| Dzierga Andrew | -- | -- |
Source: Public Records
Mortgage History
| Date | Status | Borrower | Loan Amount |
|---|---|---|---|
| Previous Owner | Dzierga Andrew | $30,000 | |
| Previous Owner | Dzierga Andrew | $52,000 | |
| Previous Owner | Dzierga Andrew | $25,000 |
Source: Public Records
Tax History Compared to Growth
Tax History
| Year | Tax Paid | Tax Assessment Tax Assessment Total Assessment is a certain percentage of the fair market value that is determined by local assessors to be the total taxable value of land and additions on the property. | Land | Improvement |
|---|---|---|---|---|
| 2025 | $4,855 | $285,400 | $56,300 | $229,100 |
| 2024 | $4,573 | $260,700 | $52,900 | $207,800 |
| 2023 | $4,252 | $229,200 | $48,100 | $181,100 |
| 2022 | $4,042 | $193,500 | $41,800 | $151,700 |
| 2021 | $3,925 | $173,500 | $41,800 | $131,700 |
| 2020 | $3,728 | $170,400 | $42,200 | $128,200 |
| 2019 | $3,645 | $170,400 | $42,200 | $128,200 |
| 2018 | $3,671 | $165,300 | $42,200 | $123,100 |
| 2017 | $3,532 | $165,300 | $42,200 | $123,100 |
| 2016 | $3,395 | $158,700 | $42,200 | $116,500 |
| 2015 | $3,312 | $155,000 | $44,200 | $110,800 |
| 2014 | $3,092 | $155,000 | $44,200 | $110,800 |
Source: Public Records
Map
Nearby Homes