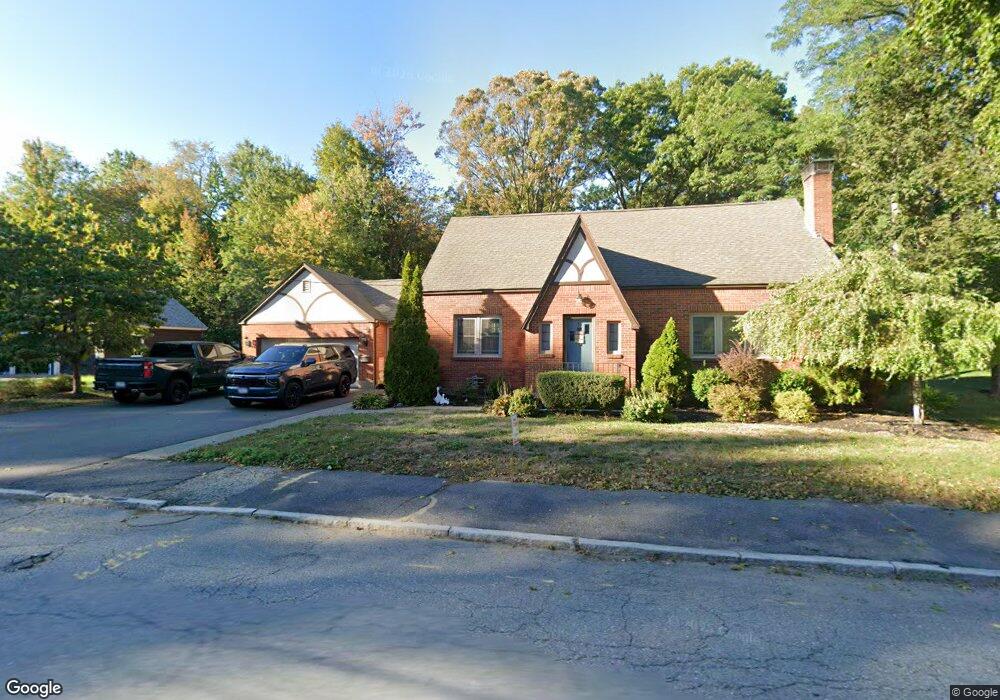
59 Ellis St Fitchburg, MA 01420
Southside NeighborhoodEstimated Value: $411,000 - $564,000
3
Beds
2
Baths
2,043
Sq Ft
$248/Sq Ft
Est. Value
About This Home
This home is located at 59 Ellis St, Fitchburg, MA 01420 and is currently estimated at $505,815, approximately $247 per square foot. 59 Ellis St is a home located in Worcester County with nearby schools including South Street Elementary School, Reingold Elementary School, and Crocker Elementary School.
Ownership History
Date
Name
Owned For
Owner Type
Purchase Details
Closed on
Oct 25, 2012
Sold by
Russell Carol A
Bought by
Russell Jason W
Current Estimated Value
Purchase Details
Closed on
May 23, 2008
Sold by
Safer Gary P
Bought by
Russell Carol A
Purchase Details
Closed on
Dec 31, 1996
Sold by
Debitetto Michael
Bought by
Safer Gary P
Home Financials for this Owner
Home Financials are based on the most recent Mortgage that was taken out on this home.
Original Mortgage
$128,000
Interest Rate
7.55%
Mortgage Type
Purchase Money Mortgage
Purchase Details
Closed on
Feb 11, 1988
Sold by
Madonia Marion G
Bought by
Debitetto Michael
Purchase Details
Closed on
Jan 28, 1987
Sold by
Mulcahy Gloria M
Bought by
Madonia Marion G
Create a Home Valuation Report for This Property
The Home Valuation Report is an in-depth analysis detailing your home's value as well as a comparison with similar homes in the area
Home Values in the Area
Average Home Value in this Area
Purchase History
| Date | Buyer | Sale Price | Title Company |
|---|---|---|---|
| Russell Jason W | -- | -- | |
| Russell Carol A | $275,000 | -- | |
| Safer Gary P | $160,000 | -- | |
| Debitetto Michael | $155,000 | -- | |
| Madonia Marion G | $29,752 | -- |
Source: Public Records
Mortgage History
| Date | Status | Borrower | Loan Amount |
|---|---|---|---|
| Previous Owner | Madonia Marion G | $50,000 | |
| Previous Owner | Madonia Marion G | $127,000 | |
| Previous Owner | Madonia Marion G | $128,000 |
Source: Public Records
Tax History Compared to Growth
Tax History
| Year | Tax Paid | Tax Assessment Tax Assessment Total Assessment is a certain percentage of the fair market value that is determined by local assessors to be the total taxable value of land and additions on the property. | Land | Improvement |
|---|---|---|---|---|
| 2025 | $67 | $494,500 | $107,000 | $387,500 |
| 2024 | $6,613 | $446,500 | $75,600 | $370,900 |
| 2023 | $6,334 | $395,400 | $66,200 | $329,200 |
| 2022 | $5,868 | $333,200 | $56,700 | $276,500 |
| 2021 | $5,857 | $307,800 | $45,900 | $261,900 |
| 2020 | $5,745 | $291,500 | $43,200 | $248,300 |
| 2019 | $5,534 | $270,100 | $58,100 | $212,000 |
| 2018 | $5,316 | $253,000 | $55,400 | $197,600 |
| 2017 | $4,951 | $230,400 | $55,400 | $175,000 |
| 2016 | $4,630 | $218,100 | $50,000 | $168,100 |
| 2015 | $4,485 | $216,900 | $51,300 | $165,600 |
| 2014 | $4,289 | $216,300 | $51,300 | $165,000 |
Source: Public Records
Map
Nearby Homes