Estimated Value: $359,000 - $510,000
6
Beds
3
Baths
2,671
Sq Ft
$168/Sq Ft
Est. Value
About This Home
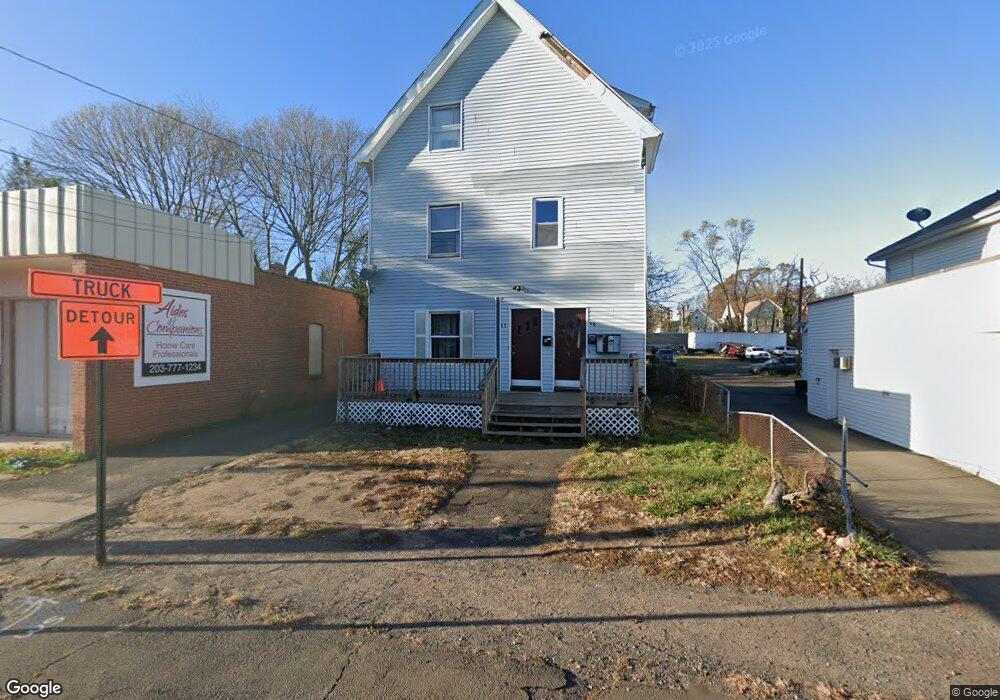
This home is located at 59 Elm St, West Haven, CT 06516 and is currently estimated at $449,000, approximately $168 per square foot. 59 Elm St is a home located in New Haven County with nearby schools including Carrigan 5/6 Intermediate School, Harry M. Bailey Middle School, and West Haven High School.
Ownership History
Date
Name
Owned For
Owner Type
Purchase Details
Closed on
Oct 20, 2016
Sold by
Wells Fargo Bank Na
Bought by
Pena Francisco
Current Estimated Value
Purchase Details
Closed on
Sep 20, 2004
Sold by
Ceniccola Bruno
Bought by
Bunting Johnnie
Home Financials for this Owner
Home Financials are based on the most recent Mortgage that was taken out on this home.
Original Mortgage
$229,500
Interest Rate
6.02%
Mortgage Type
Purchase Money Mortgage
Purchase Details
Closed on
Oct 24, 2000
Sold by
Horton Earl and Horton Florence L
Bought by
Ceniccola Bruno
Home Financials for this Owner
Home Financials are based on the most recent Mortgage that was taken out on this home.
Original Mortgage
$84,600
Interest Rate
7.88%
Mortgage Type
Purchase Money Mortgage
Create a Home Valuation Report for This Property
The Home Valuation Report is an in-depth analysis detailing your home's value as well as a comparison with similar homes in the area
Home Values in the Area
Average Home Value in this Area
Purchase History
| Date | Buyer | Sale Price | Title Company |
|---|---|---|---|
| Pena Francisco | $151,824 | -- | |
| Pena Francisco | $151,824 | -- | |
| Bunting Johnnie | $255,000 | -- | |
| Bunting Johnnie | $255,000 | -- | |
| Ceniccola Bruno | $94,000 | -- | |
| Ceniccola Bruno | $94,000 | -- |
Source: Public Records
Mortgage History
| Date | Status | Borrower | Loan Amount |
|---|---|---|---|
| Previous Owner | Ceniccola Bruno | $229,500 | |
| Previous Owner | Ceniccola Bruno | $84,600 |
Source: Public Records
Tax History Compared to Growth
Tax History
| Year | Tax Paid | Tax Assessment Tax Assessment Total Assessment is a certain percentage of the fair market value that is determined by local assessors to be the total taxable value of land and additions on the property. | Land | Improvement |
|---|---|---|---|---|
| 2025 | $8,353 | $241,920 | $60,970 | $180,950 |
| 2024 | $7,812 | $161,000 | $42,210 | $118,790 |
| 2023 | $7,488 | $161,000 | $42,210 | $118,790 |
| 2022 | $7,342 | $161,000 | $42,210 | $118,790 |
| 2021 | $12,816 | $161,000 | $42,210 | $118,790 |
| 2020 | $6,186 | $122,570 | $34,090 | $88,480 |
| 2019 | $5,965 | $122,570 | $34,090 | $88,480 |
| 2018 | $12,336 | $122,570 | $34,090 | $88,480 |
| 2017 | $12,079 | $122,570 | $34,090 | $88,480 |
| 2016 | $5,584 | $122,570 | $34,090 | $88,480 |
| 2015 | $5,324 | $131,950 | $37,590 | $94,360 |
| 2014 | $5,291 | $131,950 | $37,590 | $94,360 |
Source: Public Records
Map
Nearby Homes
- 484 1st Ave Unit 6
- 524 1st Ave
- 682 2nd Ave
- 82 Main St
- 141 Center St
- 170 Wood St
- 196 Center St
- 677 Washington Ave
- 25 Richards St
- 246 Elm St
- 285 Main St
- 24 George St
- 22 Thill St
- 112 Union Ave
- 109 Harbour Close Unit 109
- 117 Harbour Close Unit 117
- 127 Harbour Close Unit 127
- 74 Harbour Close Unit 74
- 300 Harbour Close Unit R
- 28 Wharton St