Estimated Value: $440,871 - $612,000
--
Bed
--
Bath
1,485
Sq Ft
$376/Sq Ft
Est. Value
About This Home
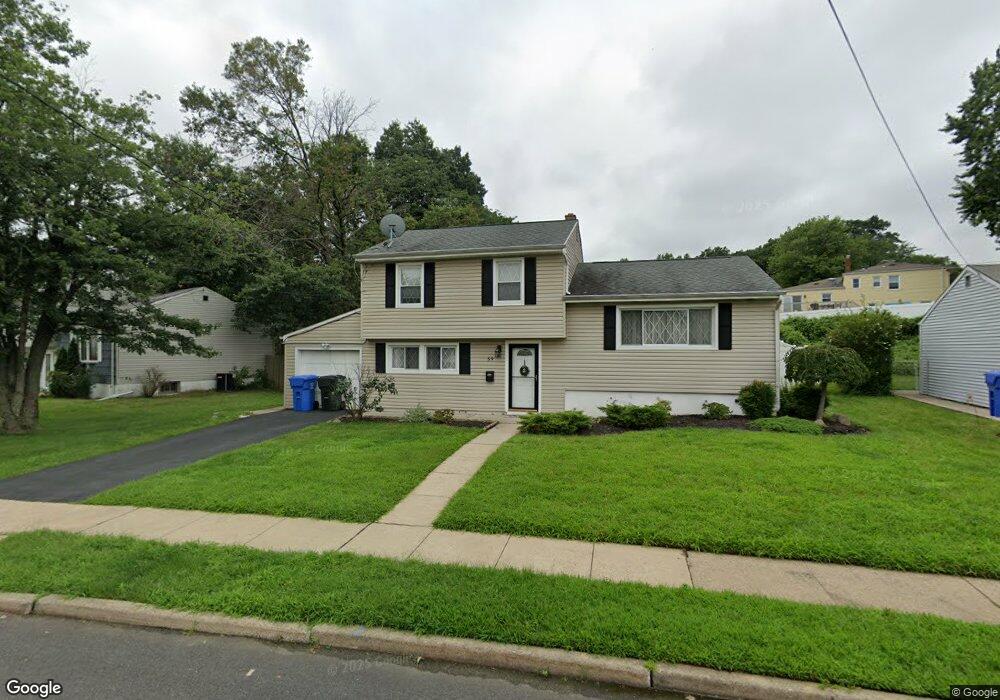
This home is located at 59 Erik Dr, Fords, NJ 08863 and is currently estimated at $558,218, approximately $375 per square foot. 59 Erik Dr is a home located in Middlesex County with nearby schools including Ford Avenue Elementary School, Fords Middle School, and Woodbridge High School.
Ownership History
Date
Name
Owned For
Owner Type
Purchase Details
Closed on
Oct 31, 2008
Sold by
Felix Joseph R and Felix Myra G
Bought by
Felix Myra G
Current Estimated Value
Home Financials for this Owner
Home Financials are based on the most recent Mortgage that was taken out on this home.
Original Mortgage
$195,000
Outstanding Balance
$121,387
Interest Rate
5.06%
Mortgage Type
New Conventional
Estimated Equity
$436,831
Purchase Details
Closed on
Aug 30, 2002
Sold by
Picco Mary
Bought by
Felix Joseph and Felix Myra
Home Financials for this Owner
Home Financials are based on the most recent Mortgage that was taken out on this home.
Original Mortgage
$211,200
Interest Rate
6.24%
Create a Home Valuation Report for This Property
The Home Valuation Report is an in-depth analysis detailing your home's value as well as a comparison with similar homes in the area
Home Values in the Area
Average Home Value in this Area
Purchase History
| Date | Buyer | Sale Price | Title Company |
|---|---|---|---|
| Felix Myra G | -- | Old Republic National Title | |
| Felix Joseph | $264,000 | -- |
Source: Public Records
Mortgage History
| Date | Status | Borrower | Loan Amount |
|---|---|---|---|
| Open | Felix Myra G | $195,000 | |
| Closed | Felix Joseph | $211,200 |
Source: Public Records
Tax History Compared to Growth
Tax History
| Year | Tax Paid | Tax Assessment Tax Assessment Total Assessment is a certain percentage of the fair market value that is determined by local assessors to be the total taxable value of land and additions on the property. | Land | Improvement |
|---|---|---|---|---|
| 2025 | $9,874 | $78,200 | $23,100 | $55,100 |
| 2024 | $9,587 | $78,200 | $23,100 | $55,100 |
| 2023 | $9,587 | $78,200 | $23,100 | $55,100 |
| 2022 | $9,328 | $78,200 | $23,100 | $55,100 |
| 2021 | $9,232 | $78,200 | $23,100 | $55,100 |
| 2020 | $8,932 | $78,200 | $23,100 | $55,100 |
| 2019 | $8,702 | $78,200 | $23,100 | $55,100 |
| 2018 | $8,530 | $78,200 | $23,100 | $55,100 |
| 2017 | $8,198 | $76,500 | $23,100 | $53,400 |
| 2016 | $8,130 | $76,500 | $23,100 | $53,400 |
| 2015 | $7,972 | $76,500 | $23,100 | $53,400 |
| 2014 | $7,798 | $76,500 | $23,100 | $53,400 |
Source: Public Records
Map
Nearby Homes