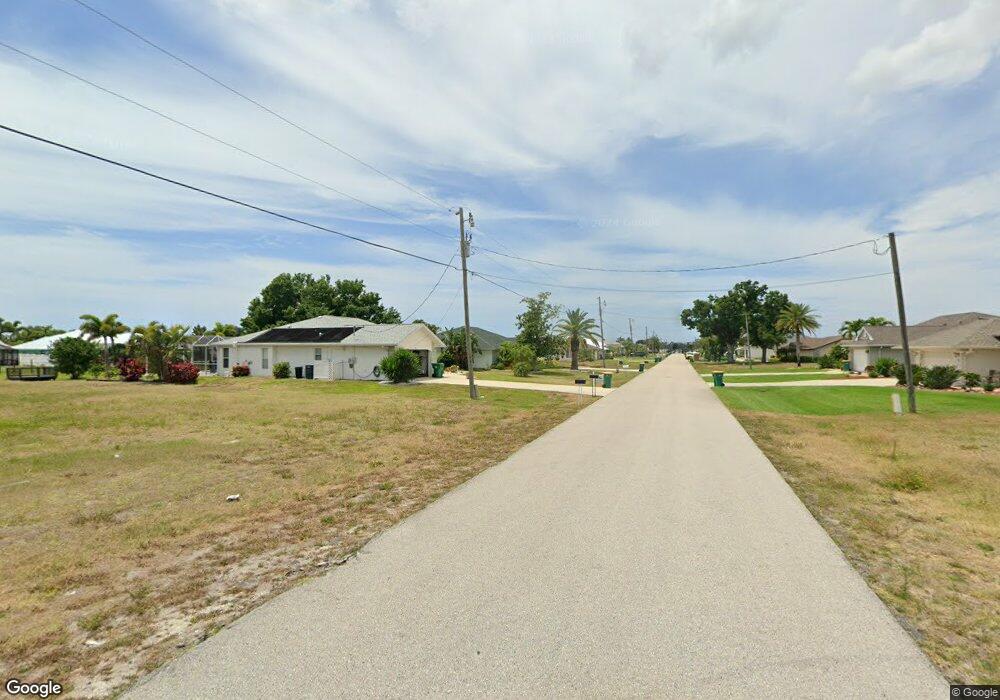
59 Fairway Rd Rotonda West, FL 33947
Estimated Value: $366,353 - $440,000
3
Beds
2
Baths
1,861
Sq Ft
$217/Sq Ft
Est. Value
About This Home
This home is located at 59 Fairway Rd, Rotonda West, FL 33947 and is currently estimated at $403,838, approximately $217 per square foot. 59 Fairway Rd is a home located in Charlotte County with nearby schools including Vineland Elementary School, L.A. Ainger Middle School, and Lemon Bay High School.
Ownership History
Date
Name
Owned For
Owner Type
Purchase Details
Closed on
Apr 30, 2009
Sold by
Kubisch John C and Kubisch Nadine M
Bought by
Scott William B and Scott Ellen A
Current Estimated Value
Home Financials for this Owner
Home Financials are based on the most recent Mortgage that was taken out on this home.
Original Mortgage
$125,000
Interest Rate
4.86%
Mortgage Type
Purchase Money Mortgage
Purchase Details
Closed on
Dec 16, 2002
Sold by
Quatrine Patricia
Bought by
Kubisch John C and Kubisch Nadine M
Home Financials for this Owner
Home Financials are based on the most recent Mortgage that was taken out on this home.
Original Mortgage
$150,000
Interest Rate
5.99%
Purchase Details
Closed on
Dec 16, 1997
Sold by
Martin James S and Martin Delores M
Bought by
Quatrine Patricia
Create a Home Valuation Report for This Property
The Home Valuation Report is an in-depth analysis detailing your home's value as well as a comparison with similar homes in the area
Home Values in the Area
Average Home Value in this Area
Purchase History
| Date | Buyer | Sale Price | Title Company |
|---|---|---|---|
| Scott William B | $175,000 | Chelsea Title Company | |
| Kubisch John C | $187,800 | -- | |
| Quatrine Patricia | $130,000 | -- |
Source: Public Records
Mortgage History
| Date | Status | Borrower | Loan Amount |
|---|---|---|---|
| Closed | Scott William B | $125,000 | |
| Previous Owner | Kubisch John C | $150,000 |
Source: Public Records
Tax History Compared to Growth
Tax History
| Year | Tax Paid | Tax Assessment Tax Assessment Total Assessment is a certain percentage of the fair market value that is determined by local assessors to be the total taxable value of land and additions on the property. | Land | Improvement |
|---|---|---|---|---|
| 2023 | $5,148 | $299,088 | $0 | $0 |
| 2022 | $5,609 | $328,302 | $39,950 | $288,352 |
| 2021 | $4,507 | $212,929 | $18,700 | $194,229 |
| 2020 | $4,090 | $199,828 | $17,000 | $182,828 |
| 2019 | $3,966 | $204,604 | $19,975 | $184,629 |
| 2018 | $3,688 | $212,053 | $19,975 | $192,078 |
| 2017 | $3,428 | $191,264 | $21,250 | $170,014 |
| 2016 | $3,153 | $156,894 | $0 | $0 |
| 2015 | $2,865 | $142,631 | $0 | $0 |
| 2014 | $2,955 | $147,436 | $0 | $0 |
Source: Public Records
Map
Nearby Homes