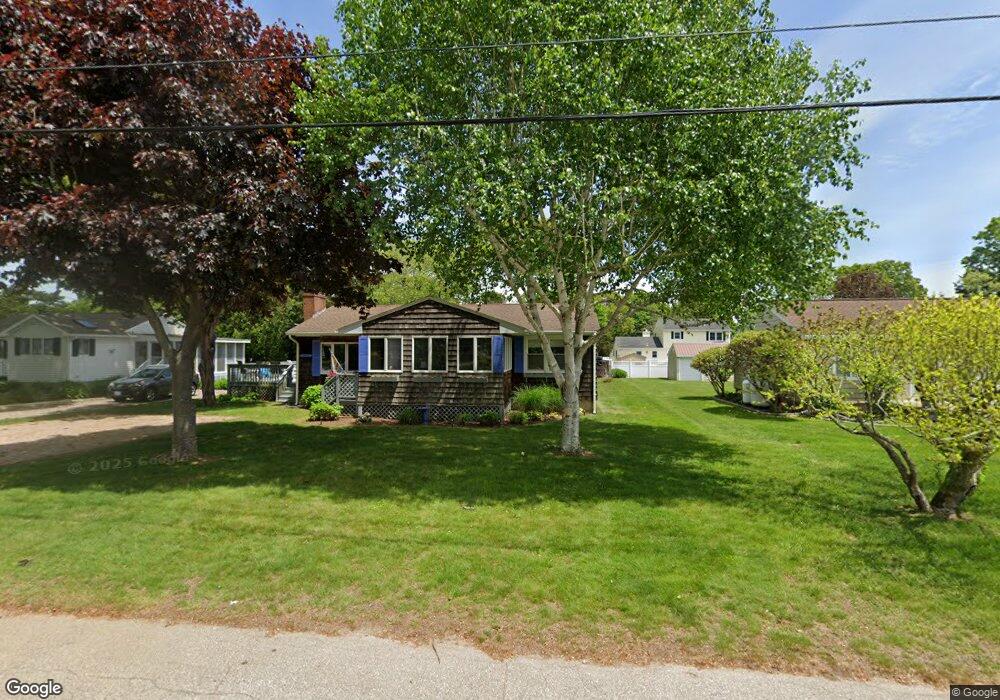
59 Fishermans Ave Westerly, RI 02891
Estimated Value: $791,546 - $952,000
3
Beds
1
Bath
1,120
Sq Ft
$781/Sq Ft
Est. Value
About This Home
This home is located at 59 Fishermans Ave, Westerly, RI 02891 and is currently estimated at $875,137, approximately $781 per square foot. 59 Fishermans Ave is a home located in Washington County with nearby schools including Westerly High School and St. Michael School.
Ownership History
Date
Name
Owned For
Owner Type
Purchase Details
Closed on
Jun 5, 2020
Sold by
Holmes Stephen A
Bought by
La Holmes Llc
Current Estimated Value
Home Financials for this Owner
Home Financials are based on the most recent Mortgage that was taken out on this home.
Original Mortgage
$450,000
Outstanding Balance
$398,008
Interest Rate
3.2%
Mortgage Type
New Conventional
Estimated Equity
$477,129
Create a Home Valuation Report for This Property
The Home Valuation Report is an in-depth analysis detailing your home's value as well as a comparison with similar homes in the area
Home Values in the Area
Average Home Value in this Area
Purchase History
| Date | Buyer | Sale Price | Title Company |
|---|---|---|---|
| La Holmes Llc | -- | None Available | |
| La Holmes Llc | -- | None Available | |
| La Holmes Llc | -- | None Available |
Source: Public Records
Mortgage History
| Date | Status | Borrower | Loan Amount |
|---|---|---|---|
| Open | La Holmes Llc | $450,000 | |
| Closed | La Holmes Llc | $450,000 |
Source: Public Records
Tax History Compared to Growth
Tax History
| Year | Tax Paid | Tax Assessment Tax Assessment Total Assessment is a certain percentage of the fair market value that is determined by local assessors to be the total taxable value of land and additions on the property. | Land | Improvement |
|---|---|---|---|---|
| 2025 | $5,311 | $747,000 | $589,400 | $157,600 |
| 2024 | $5,427 | $553,200 | $421,200 | $132,000 |
| 2023 | $5,322 | $553,200 | $421,200 | $132,000 |
| 2022 | $5,289 | $553,200 | $421,200 | $132,000 |
| 2021 | $4,669 | $405,300 | $305,400 | $99,900 |
| 2020 | $4,584 | $405,300 | $305,400 | $99,900 |
| 2019 | $4,539 | $405,300 | $305,400 | $99,900 |
| 2018 | $4,318 | $363,500 | $277,600 | $85,900 |
| 2017 | $4,213 | $363,500 | $277,600 | $85,900 |
| 2016 | $4,246 | $363,500 | $277,600 | $85,900 |
| 2015 | $4,100 | $378,900 | $283,300 | $95,600 |
| 2014 | $3,672 | $378,900 | $283,300 | $95,600 |
Source: Public Records
Map
Nearby Homes
- 32 Crandall Ave
- 11 Rabbit Run
- 9 Montauk Ave
- 10 Tristam St
- 13 No Bottom Ridge Rd
- 26 Windward Dr
- 9 Compass Way Unit 201
- 9 Compass Way Unit 202
- 9 Compass Way Unit 101
- 9 Compass Way Unit 102
- 9 Compass Way Unit 103
- 9 Compass Way Unit 203
- 18 No Bottom Ridge Ridge
- 7 Spring Pond Rd
- 4 Shore Rd
- 6 Newbury Dr
- 19 E Hills Rd
- 17 E Hills Rd
- 4 Quail Run
- 6 Fox Run Run
- 57 Fishermans Ave
- 55 Fishermans Ave
- 58 Fishermans Ave
- 62 Fishermans Ave
- 61 Fishermans Ave
- 63 Fishermans Ave
- 24 2nd St
- 62 Lawton Ave
- 64 Fishermans Ave
- 64 Lawton Ave
- 20 2nd St
- 26 2nd St
- 18 Fishermans Ave
- 65 Fishermans Ave
- 56 Fishermans Ave
- 60 Lawton Ave
- 66 Fishermans Ave
- 66 Lawton Ave
- 66 Fishermans Ave
- 53 Kimball Ave