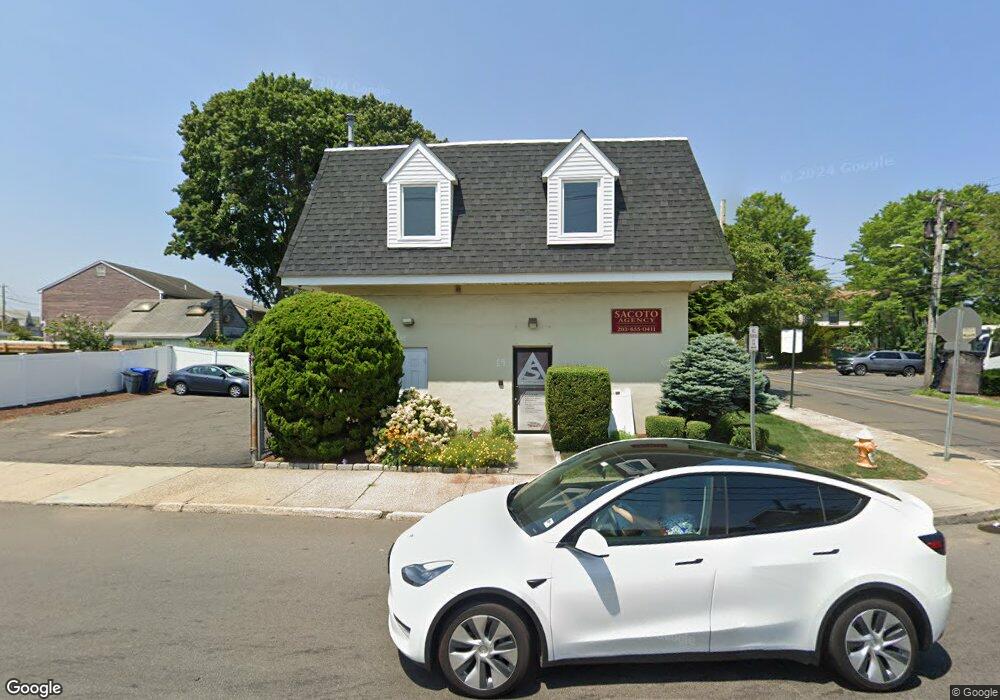
59 Fort Point St Norwalk, CT 06855
East Norwalk NeighborhoodEstimated Value: $617,170
--
Bed
--
Bath
2,244
Sq Ft
$275/Sq Ft
Est. Value
About This Home
This home is located at 59 Fort Point St, Norwalk, CT 06855 and is currently estimated at $617,170, approximately $275 per square foot. 59 Fort Point St is a home located in Fairfield County with nearby schools including Marvin Elementary School, Nathan Hale Middle School, and Norwalk High School.
Ownership History
Date
Name
Owned For
Owner Type
Purchase Details
Closed on
Aug 9, 2010
Sold by
Pinto-Pond Patricia
Bought by
Nbfppp Llc
Current Estimated Value
Purchase Details
Closed on
Dec 22, 1998
Sold by
Arena Marcia
Bought by
Pond Patricia P
Home Financials for this Owner
Home Financials are based on the most recent Mortgage that was taken out on this home.
Original Mortgage
$145,000
Interest Rate
5.95%
Mortgage Type
Commercial
Purchase Details
Closed on
Jun 12, 1996
Sold by
Fort Point Realty Inc
Bought by
Arena Richard
Create a Home Valuation Report for This Property
The Home Valuation Report is an in-depth analysis detailing your home's value as well as a comparison with similar homes in the area
Home Values in the Area
Average Home Value in this Area
Purchase History
| Date | Buyer | Sale Price | Title Company |
|---|---|---|---|
| Nbfppp Llc | -- | -- | |
| Nbfppp Llc | -- | -- | |
| Pond Patricia P | $205,000 | -- | |
| Pond Patricia P | $205,000 | -- | |
| Arena Richard | $205,000 | -- | |
| Arena Richard | $205,000 | -- |
Source: Public Records
Mortgage History
| Date | Status | Borrower | Loan Amount |
|---|---|---|---|
| Previous Owner | Arena Richard | $145,000 | |
| Previous Owner | Arena Richard | $250,000 |
Source: Public Records
Tax History Compared to Growth
Tax History
| Year | Tax Paid | Tax Assessment Tax Assessment Total Assessment is a certain percentage of the fair market value that is determined by local assessors to be the total taxable value of land and additions on the property. | Land | Improvement |
|---|---|---|---|---|
| 2025 | $7,160 | $299,570 | $187,520 | $112,050 |
| 2024 | $7,053 | $299,570 | $187,520 | $112,050 |
| 2023 | $8,605 | $343,020 | $170,980 | $172,040 |
| 2022 | $8,531 | $347,570 | $170,980 | $176,590 |
| 2021 | $8,331 | $347,570 | $170,980 | $176,590 |
| 2020 | $8,326 | $347,570 | $170,980 | $176,590 |
| 2019 | $8,104 | $347,570 | $170,980 | $176,590 |
| 2018 | $7,525 | $282,850 | $117,730 | $165,120 |
| 2017 | $7,264 | $282,850 | $117,730 | $165,120 |
| 2016 | $7,196 | $282,850 | $117,730 | $165,120 |
| 2015 | $7,176 | $282,850 | $117,730 | $165,120 |
| 2014 | $7,083 | $282,850 | $117,730 | $165,120 |
Source: Public Records
Map
Nearby Homes
- 17 Pleasant St
- 26 Rowan St
- 4 van Zant St Unit B8
- 189 East Ave
- 281 East Ave
- 301 East Ave
- 16 Elton Ct
- 1 1/2 Colony Place
- 100 Seaview Ave Unit 3I
- 6 Willow St
- 38 Gregory Blvd
- 33 N Water St Unit 607
- 33 N Water St Unit 505
- 33 N Water St Unit 804
- 32 Pine St Unit 26
- 12 Pine Hill Ave
- 131 Washington St Unit 204
- 142 East Ave Unit A103
- 142 East Ave Unit 403
- 142 East Ave Unit A304
- 49 Osborne Ave
- 49 Osborne Ave Unit 2
- 49 Osborne Ave Unit 1
- 45 Osborne Ave
- 2 Charles St
- 46 Osborne Ave
- 4 Charles St
- 43 Osborne Ave
- 51 Osborne Ave
- 6 Charles St
- 41 Osborne Ave
- 56 Fort Point St
- 53 Osborne Ave
- 53 Osborne Ave Unit 3
- 53 Osborne Ave Unit 1
- 53 Osborne Ave Unit 2
- 50 Osborne Ave
- 39 Osborne Ave
- 8 Charles St Unit B
- 8 Charles St Unit A