59 Freesia Ct Holmdel, NJ 07733
Estimated Value: $804,000 - $881,000
2
Beds
1
Bath
1,936
Sq Ft
$429/Sq Ft
Est. Value
About This Home
This home is located at 59 Freesia Ct, Holmdel, NJ 07733 and is currently estimated at $829,808, approximately $428 per square foot. 59 Freesia Ct is a home located in Monmouth County with nearby schools including Village School, Indian Hill Elementary School, and William Satz Intermediate School.
Ownership History
Date
Name
Owned For
Owner Type
Purchase Details
Closed on
May 13, 2025
Sold by
Sholom James and Sholom Beth
Bought by
Sholom Family Living Trust and Sholom
Current Estimated Value
Purchase Details
Closed on
Jun 11, 2021
Sold by
Dimattina Stella
Bought by
Protentis Thomas Dennis and Protentis Andrea Veronica
Home Financials for this Owner
Home Financials are based on the most recent Mortgage that was taken out on this home.
Original Mortgage
$120,000
Interest Rate
2.9%
Mortgage Type
New Conventional
Purchase Details
Closed on
Jun 25, 1998
Sold by
Dr Horton Inc
Bought by
Dimattina Bart and Dimattina Stella
Home Financials for this Owner
Home Financials are based on the most recent Mortgage that was taken out on this home.
Original Mortgage
$223,000
Interest Rate
7.04%
Create a Home Valuation Report for This Property
The Home Valuation Report is an in-depth analysis detailing your home's value as well as a comparison with similar homes in the area
Home Values in the Area
Average Home Value in this Area
Purchase History
| Date | Buyer | Sale Price | Title Company |
|---|---|---|---|
| Sholom Family Living Trust | -- | None Listed On Document | |
| Protentis Thomas Dennis | $600,000 | None Available | |
| Protentis Thomas Dennis | $600,000 | Afrm Title & Abstract | |
| Dimattina Bart | $278,940 | -- |
Source: Public Records
Mortgage History
| Date | Status | Borrower | Loan Amount |
|---|---|---|---|
| Previous Owner | Protentis Thomas Dennis | $120,000 | |
| Previous Owner | Dimattina Bart | $223,000 |
Source: Public Records
Tax History Compared to Growth
Tax History
| Year | Tax Paid | Tax Assessment Tax Assessment Total Assessment is a certain percentage of the fair market value that is determined by local assessors to be the total taxable value of land and additions on the property. | Land | Improvement |
|---|---|---|---|---|
| 2025 | $11,338 | $786,500 | $350,700 | $435,800 |
| 2024 | $11,674 | $719,400 | $318,200 | $401,200 |
| 2023 | $11,674 | $717,500 | $341,500 | $376,000 |
| 2022 | $10,290 | $613,600 | $304,700 | $308,900 |
| 2021 | $10,361 | $525,400 | $222,100 | $303,300 |
| 2020 | $10,611 | $520,400 | $203,100 | $317,300 |
| 2019 | $10,283 | $506,800 | $174,100 | $332,700 |
| 2018 | $9,573 | $473,700 | $135,000 | $338,700 |
| 2017 | $9,309 | $458,800 | $124,900 | $333,900 |
| 2016 | $9,133 | $455,300 | $105,900 | $349,400 |
| 2015 | $8,867 | $456,100 | $120,200 | $335,900 |
| 2014 | $9,575 | $470,100 | $196,200 | $273,900 |
Source: Public Records
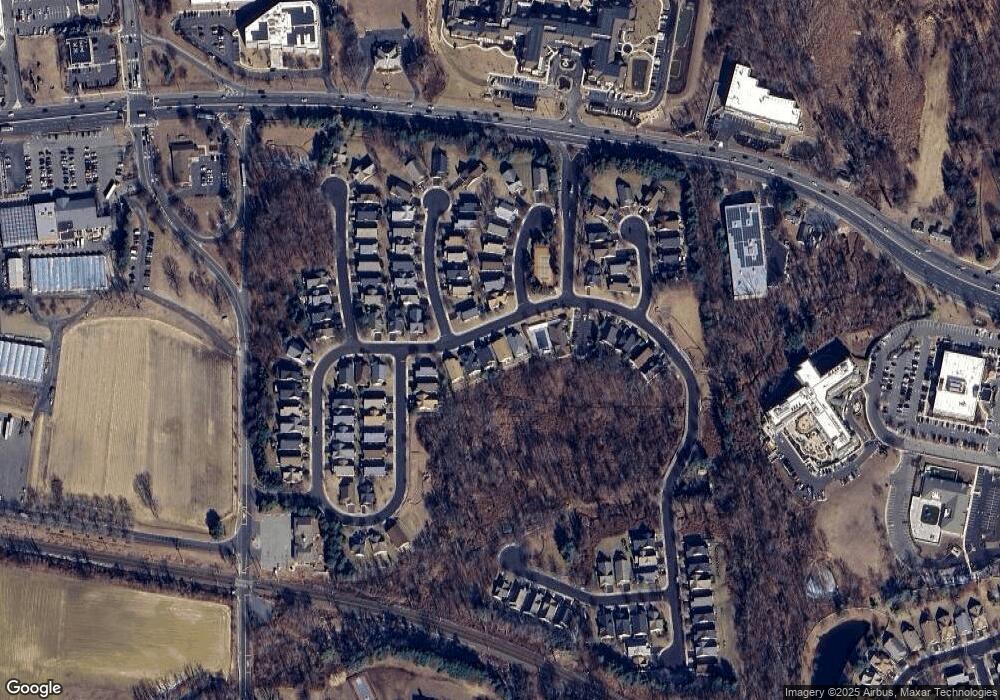
Map
Nearby Homes
- 35 Violet Ct
- 32 Bristel Rd Unit 212
- 64 Hawthorne Ave
- 8 Stagecoach Dr Unit 13
- 7 Red Coach Ln
- 4 Pine Tree Terrace
- 58 Agostina Dr Unit 250
- 22 Weller Place Unit 22
- 64 Agostina Dr Unit 64
- 53 Lafayette Dr
- 9 Boxwood Terrace
- 1305 Arose Ln
- 343 Middlewood Rd
- 6 Ridge Dr
- 27 Gibson Dr
- 901 Palmer Ave
- 44 Devonshire Ct
- 117 Sequoia Woods Ct
- 544 Lane F
- 8 Leocadia Ct