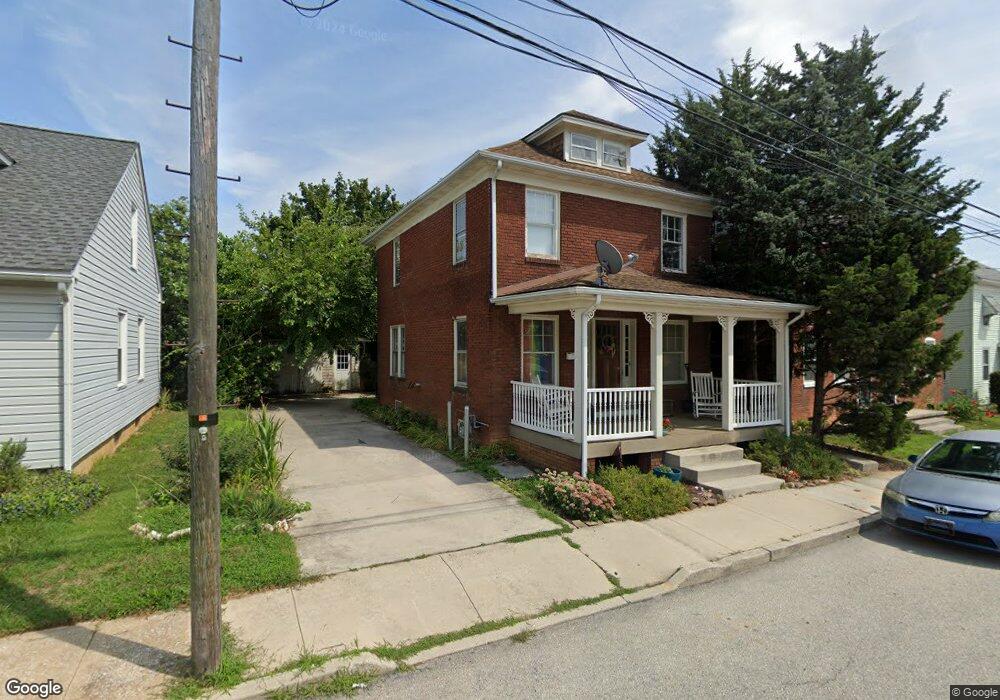
59 George St Hanover, PA 17331
Hanover Historic District NeighborhoodEstimated Value: $195,437 - $247,000
2
Beds
1
Bath
1,232
Sq Ft
$182/Sq Ft
Est. Value
About This Home
This home is located at 59 George St, Hanover, PA 17331 and is currently estimated at $224,359, approximately $182 per square foot. 59 George St is a home located in York County with nearby schools including Clearview Elementary School, Washington Elementary School, and Hanover Middle School.
Ownership History
Date
Name
Owned For
Owner Type
Purchase Details
Closed on
Jun 15, 2007
Sold by
Neal Brandon M and Neal Jessica S
Bought by
Pensinger Matthew B and Pensinger Deborah E
Current Estimated Value
Home Financials for this Owner
Home Financials are based on the most recent Mortgage that was taken out on this home.
Original Mortgage
$193,000
Outstanding Balance
$117,776
Interest Rate
6.14%
Mortgage Type
Purchase Money Mortgage
Estimated Equity
$106,583
Purchase Details
Closed on
Apr 30, 2003
Sold by
Lovelace Robert B and Lovelace Holly A
Bought by
Neal Brandon M and Neal Jessica S
Home Financials for this Owner
Home Financials are based on the most recent Mortgage that was taken out on this home.
Original Mortgage
$77,900
Interest Rate
5.84%
Mortgage Type
Purchase Money Mortgage
Create a Home Valuation Report for This Property
The Home Valuation Report is an in-depth analysis detailing your home's value as well as a comparison with similar homes in the area
Home Values in the Area
Average Home Value in this Area
Purchase History
| Date | Buyer | Sale Price | Title Company |
|---|---|---|---|
| Pensinger Matthew B | $189,900 | None Available | |
| Neal Brandon M | $82,000 | Chicago Title Insurance Co |
Source: Public Records
Mortgage History
| Date | Status | Borrower | Loan Amount |
|---|---|---|---|
| Open | Pensinger Matthew B | $193,000 | |
| Previous Owner | Neal Brandon M | $77,900 |
Source: Public Records
Tax History Compared to Growth
Tax History
| Year | Tax Paid | Tax Assessment Tax Assessment Total Assessment is a certain percentage of the fair market value that is determined by local assessors to be the total taxable value of land and additions on the property. | Land | Improvement |
|---|---|---|---|---|
| 2025 | $3,537 | $96,600 | $20,880 | $75,720 |
| 2024 | $3,509 | $96,600 | $20,880 | $75,720 |
| 2023 | $3,482 | $96,600 | $20,880 | $75,720 |
| 2022 | $3,440 | $96,600 | $20,880 | $75,720 |
| 2021 | $3,343 | $96,600 | $20,880 | $75,720 |
| 2020 | $3,343 | $96,600 | $20,880 | $75,720 |
| 2019 | $3,291 | $96,600 | $20,880 | $75,720 |
| 2018 | $3,230 | $96,600 | $20,880 | $75,720 |
| 2017 | $3,169 | $96,600 | $20,880 | $75,720 |
| 2016 | $0 | $96,600 | $20,880 | $75,720 |
| 2015 | -- | $96,600 | $20,880 | $75,720 |
| 2014 | -- | $96,600 | $20,880 | $75,720 |
Source: Public Records
Map
Nearby Homes