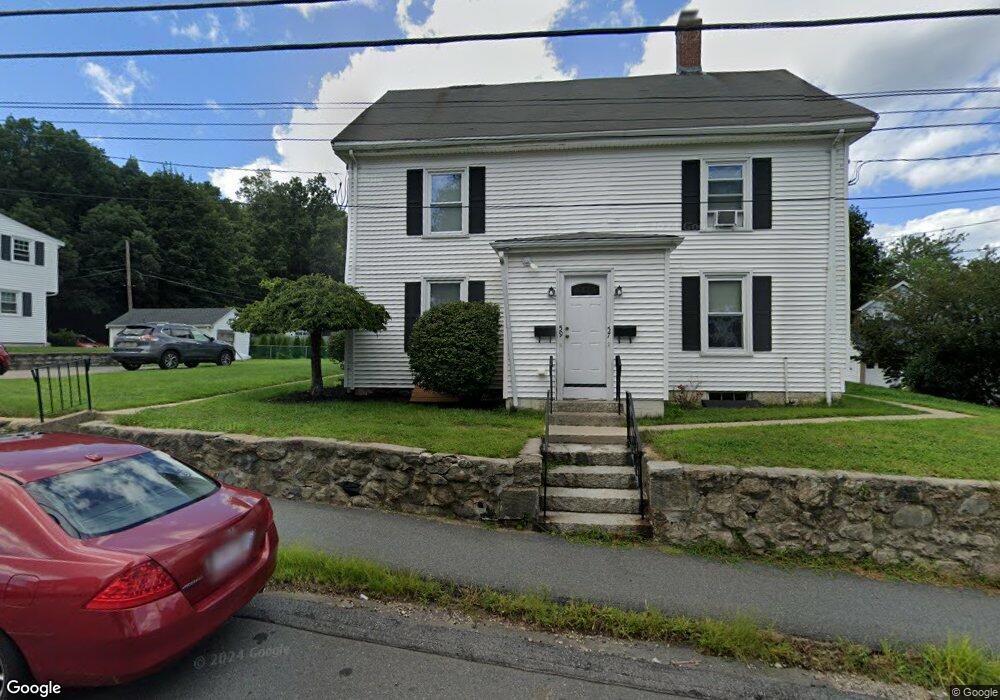
59 Harrison Ave Woburn, MA 01801
Downtown Woburn NeighborhoodEstimated Value: $640,000 - $931,000
2
Beds
3
Baths
1,316
Sq Ft
$551/Sq Ft
Est. Value
About This Home
This home is located at 59 Harrison Ave, Woburn, MA 01801 and is currently estimated at $725,115, approximately $550 per square foot. 59 Harrison Ave is a home located in Middlesex County with nearby schools including Hurld Elementary School, Daniel L. Joyce Middle School, and Woburn High School.
Ownership History
Date
Name
Owned For
Owner Type
Purchase Details
Closed on
Aug 19, 2019
Sold by
Cialdea Frederick and Cialdea Bruce
Bought by
Moniz Cassandra
Current Estimated Value
Home Financials for this Owner
Home Financials are based on the most recent Mortgage that was taken out on this home.
Original Mortgage
$553,500
Outstanding Balance
$484,764
Interest Rate
3.7%
Mortgage Type
New Conventional
Estimated Equity
$240,351
Purchase Details
Closed on
Oct 6, 2016
Sold by
Mceleney Ft
Bought by
Cialdea Frederick and Cialdea Bruce
Create a Home Valuation Report for This Property
The Home Valuation Report is an in-depth analysis detailing your home's value as well as a comparison with similar homes in the area
Home Values in the Area
Average Home Value in this Area
Purchase History
| Date | Buyer | Sale Price | Title Company |
|---|---|---|---|
| Moniz Cassandra | $615,000 | -- | |
| Cialdea Frederick | $214,000 | -- |
Source: Public Records
Mortgage History
| Date | Status | Borrower | Loan Amount |
|---|---|---|---|
| Open | Moniz Cassandra | $553,500 |
Source: Public Records
Tax History Compared to Growth
Tax History
| Year | Tax Paid | Tax Assessment Tax Assessment Total Assessment is a certain percentage of the fair market value that is determined by local assessors to be the total taxable value of land and additions on the property. | Land | Improvement |
|---|---|---|---|---|
| 2025 | $4,830 | $565,600 | $307,700 | $257,900 |
| 2024 | $4,302 | $533,700 | $293,000 | $240,700 |
| 2023 | $4,322 | $496,800 | $266,400 | $230,400 |
| 2022 | $4,144 | $443,700 | $231,600 | $212,100 |
| 2021 | $3,690 | $395,500 | $220,600 | $174,900 |
| 2020 | $3,673 | $394,100 | $220,300 | $173,800 |
| 2019 | $3,572 | $376,000 | $209,800 | $166,200 |
| 2018 | $3,388 | $342,600 | $192,500 | $150,100 |
| 2017 | $3,111 | $313,000 | $183,300 | $129,700 |
| 2016 | $2,962 | $294,700 | $171,300 | $123,400 |
| 2015 | $2,839 | $279,200 | $160,100 | $119,100 |
| 2014 | $2,783 | $266,600 | $160,100 | $106,500 |
Source: Public Records
Map
Nearby Homes
- 80 N Warren St Unit 36
- 6 Oak Knoll Dr
- 10 Beacon St Unit 105
- 78 Kilby St
- 18 Beacon St Unit 18
- 9 Arlington Rd
- 22 Beacon St
- 26 Flagg St
- 31 Arlington Rd Unit 1-6
- 29 Arlington Rd Unit 4
- 13 Center St
- 11 Hovey St
- 7 Locust St
- 9 Locust St
- 112 Burlington St
- 477 Main St
- 7 Prospect St
- 14 Church Ave
- 34 Union St
- 462 Place Ln