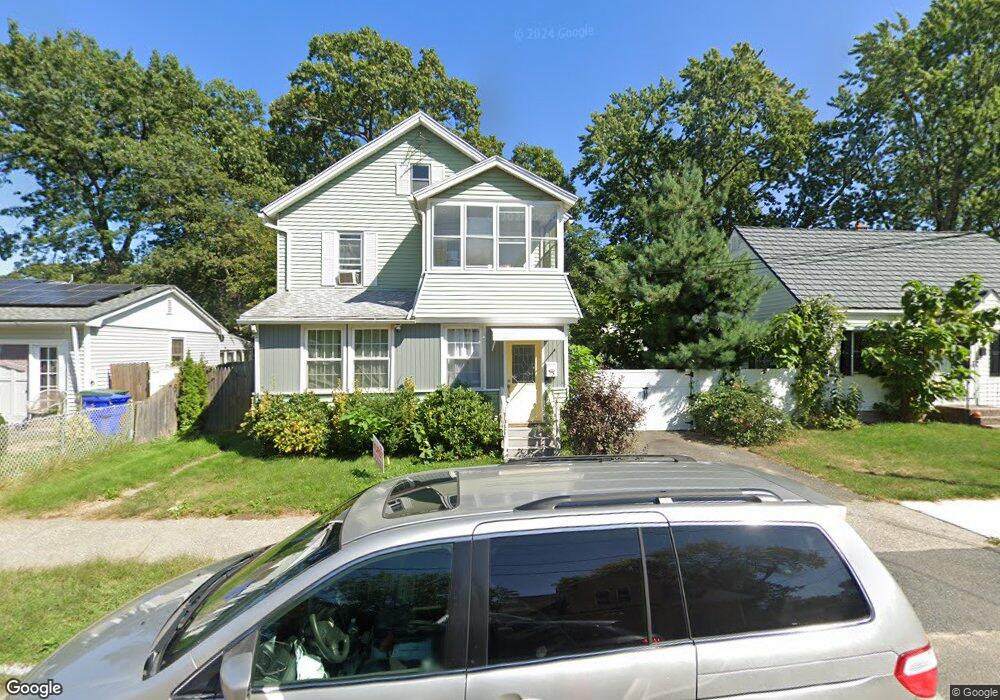
59 Haskin St Springfield, MA 01109
Pine Point NeighborhoodEstimated Value: $288,000 - $408,000
4
Beds
2
Baths
1,536
Sq Ft
$214/Sq Ft
Est. Value
About This Home
This home is located at 59 Haskin St, Springfield, MA 01109 and is currently estimated at $329,091, approximately $214 per square foot. 59 Haskin St is a home located in Hampden County with nearby schools including Hiram L. Dorman Elementary, John F. Kennedy Academy, and Springfield Central High School.
Ownership History
Date
Name
Owned For
Owner Type
Purchase Details
Closed on
Sep 26, 2006
Sold by
Christian Indira and Christian Robin Me
Bought by
Mckenzie Garrett
Current Estimated Value
Home Financials for this Owner
Home Financials are based on the most recent Mortgage that was taken out on this home.
Original Mortgage
$104,000
Outstanding Balance
$61,861
Interest Rate
6.59%
Mortgage Type
Purchase Money Mortgage
Estimated Equity
$267,230
Purchase Details
Closed on
Jul 30, 2004
Sold by
Sowa Paul
Bought by
Christian Indira and Christian Robin Michael
Home Financials for this Owner
Home Financials are based on the most recent Mortgage that was taken out on this home.
Original Mortgage
$106,650
Interest Rate
6.33%
Mortgage Type
Purchase Money Mortgage
Purchase Details
Closed on
Jun 6, 2003
Sold by
Dusty Corp and 57 Haskineet Rlty Ust
Bought by
Sowa Paul
Home Financials for this Owner
Home Financials are based on the most recent Mortgage that was taken out on this home.
Original Mortgage
$103,400
Interest Rate
5.83%
Mortgage Type
Purchase Money Mortgage
Purchase Details
Closed on
Nov 2, 1988
Sold by
Putkowski Theresa J
Bought by
Cable Russell T
Purchase Details
Closed on
Feb 3, 1987
Sold by
Garner Jeffrey L
Bought by
Cable Russell T
Create a Home Valuation Report for This Property
The Home Valuation Report is an in-depth analysis detailing your home's value as well as a comparison with similar homes in the area
Home Values in the Area
Average Home Value in this Area
Purchase History
| Date | Buyer | Sale Price | Title Company |
|---|---|---|---|
| Mckenzie Garrett | $130,000 | -- | |
| Mckenzie Garrett | $130,000 | -- | |
| Christian Indira | $118,500 | -- | |
| Christian Indira | $118,500 | -- | |
| Sowa Paul | $111,900 | -- | |
| Sowa Paul | $111,900 | -- | |
| Cable Russell T | $13,750 | -- | |
| Cable Russell T | $75,100 | -- |
Source: Public Records
Mortgage History
| Date | Status | Borrower | Loan Amount |
|---|---|---|---|
| Open | Mckenzie Garrett | $104,000 | |
| Closed | Mckenzie Garrett | $26,000 | |
| Closed | Cable Russell T | $104,000 | |
| Previous Owner | Christian Indira | $106,650 | |
| Previous Owner | Sowa Paul | $103,400 |
Source: Public Records
Tax History Compared to Growth
Tax History
| Year | Tax Paid | Tax Assessment Tax Assessment Total Assessment is a certain percentage of the fair market value that is determined by local assessors to be the total taxable value of land and additions on the property. | Land | Improvement |
|---|---|---|---|---|
| 2025 | $3,721 | $237,300 | $39,000 | $198,300 |
| 2024 | $3,650 | $227,300 | $32,500 | $194,800 |
| 2023 | $3,432 | $201,300 | $29,500 | $171,800 |
| 2022 | $3,181 | $169,000 | $27,600 | $141,400 |
| 2021 | $2,878 | $152,300 | $25,100 | $127,200 |
| 2020 | $2,541 | $130,100 | $25,100 | $105,000 |
| 2019 | $2,576 | $130,900 | $25,100 | $105,800 |
| 2018 | $2,438 | $123,900 | $25,100 | $98,800 |
| 2017 | $2,573 | $130,900 | $23,200 | $107,700 |
| 2016 | $2,483 | $126,300 | $23,200 | $103,100 |
| 2015 | $2,268 | $115,300 | $23,200 | $92,100 |
Source: Public Records
Map
Nearby Homes