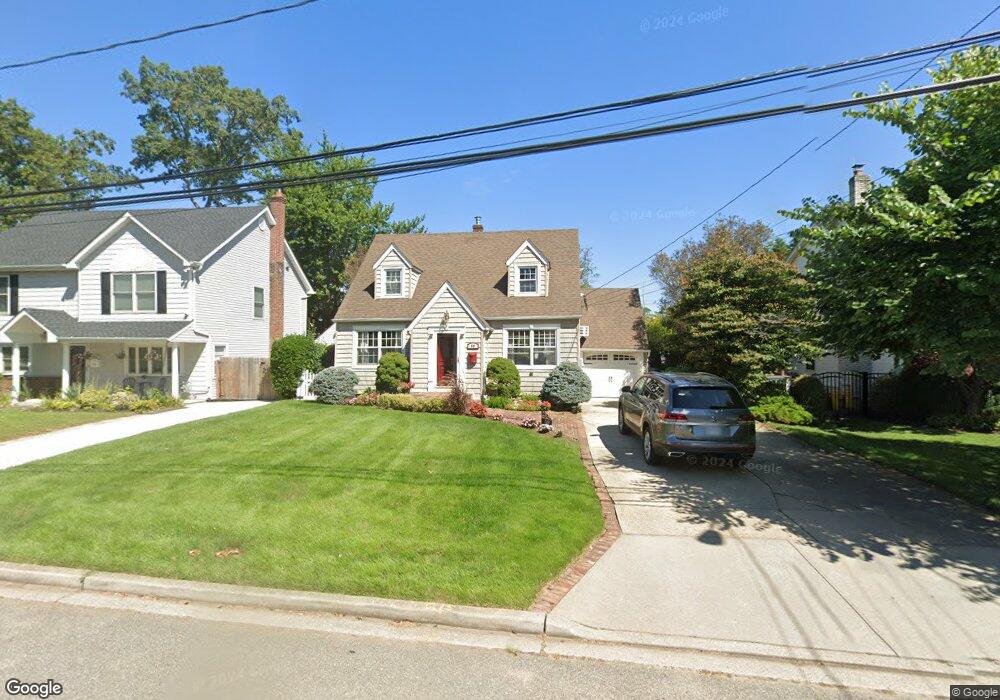
59 Hawthorne St Massapequa, NY 11758
Estimated Value: $666,568 - $717,000
--
Bed
3
Baths
1,417
Sq Ft
$488/Sq Ft
Est. Value
About This Home
This home is located at 59 Hawthorne St, Massapequa, NY 11758 and is currently estimated at $691,784, approximately $488 per square foot. 59 Hawthorne St is a home located in Nassau County with nearby schools including Massapequa High School - Ames Campus, Berner Middle School, and Massapequa High School.
Ownership History
Date
Name
Owned For
Owner Type
Purchase Details
Closed on
Mar 2, 2022
Sold by
Delury William and Delury Caroline De
Bought by
Kramps Brian T and Kramps Kelly G
Current Estimated Value
Home Financials for this Owner
Home Financials are based on the most recent Mortgage that was taken out on this home.
Original Mortgage
$480,000
Outstanding Balance
$448,475
Interest Rate
3.92%
Mortgage Type
New Conventional
Estimated Equity
$243,309
Create a Home Valuation Report for This Property
The Home Valuation Report is an in-depth analysis detailing your home's value as well as a comparison with similar homes in the area
Home Values in the Area
Average Home Value in this Area
Purchase History
| Date | Buyer | Sale Price | Title Company |
|---|---|---|---|
| Kramps Brian T | $600,000 | Advantage Title |
Source: Public Records
Mortgage History
| Date | Status | Borrower | Loan Amount |
|---|---|---|---|
| Open | Kramps Brian T | $480,000 |
Source: Public Records
Tax History Compared to Growth
Tax History
| Year | Tax Paid | Tax Assessment Tax Assessment Total Assessment is a certain percentage of the fair market value that is determined by local assessors to be the total taxable value of land and additions on the property. | Land | Improvement |
|---|---|---|---|---|
| 2025 | $12,309 | $432 | $167 | $265 |
| 2024 | $3,978 | $480 | $186 | $294 |
| 2023 | $11,889 | $477 | $185 | $292 |
| 2022 | $11,889 | $485 | $188 | $297 |
| 2021 | $8,487 | $463 | $179 | $284 |
| 2020 | $5,715 | $483 | $482 | $1 |
| 2019 | $2,657 | $518 | $517 | $1 |
| 2018 | $4,481 | $552 | $0 | $0 |
| 2017 | $4,481 | $587 | $524 | $63 |
| 2016 | $7,336 | $621 | $453 | $168 |
| 2015 | $2,864 | $656 | $478 | $178 |
| 2014 | $2,864 | $656 | $478 | $178 |
| 2013 | $3,018 | $760 | $554 | $206 |
Source: Public Records
Map
Nearby Homes
- 54 Chestnut St
- 28 Grove St
- 17 Linden St
- 63 Pennsylvania Ave
- 36 Michigan Ave
- 51 Michigan Ave
- 1872 Park Dr
- 4037 Park Dr
- 3969 Marlow Ct
- 5675 Merrick Rd
- 104 Clark Ave
- 3945 Hickory St
- 73 Chicago Ave
- 2067 Jackson Ave
- 4060 Clark St
- 37 Lakeshore Blvd
- 70 Pittsburgh Ave
- 116 Parkhill Ave
- 3861 Hickory St
- 11 Pittsburgh Ave