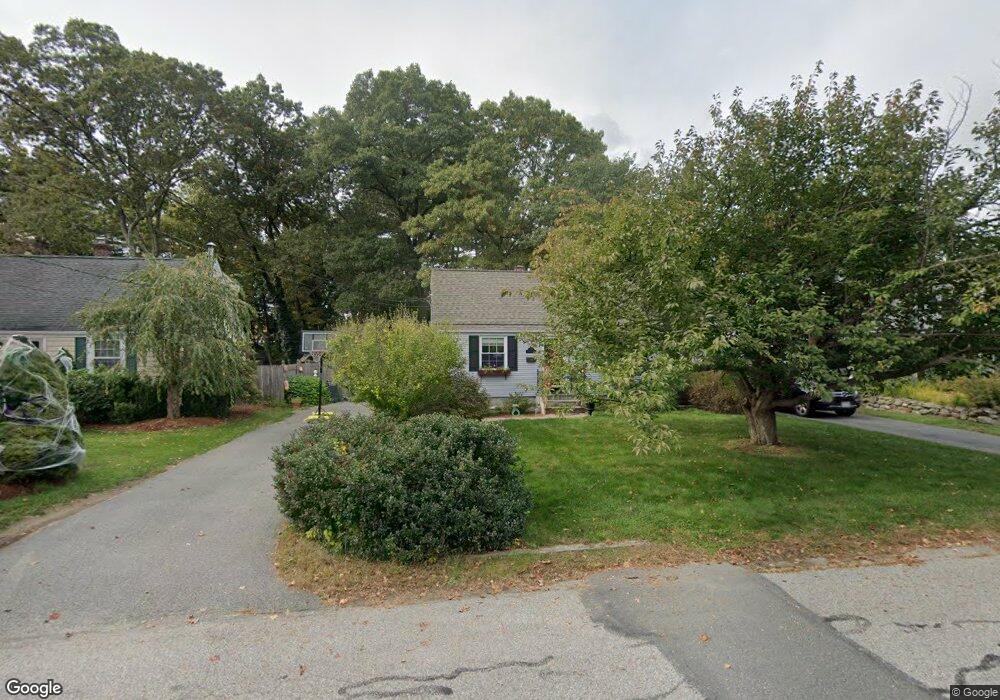
59 Higgins Rd Framingham, MA 01701
Nobscot NeighborhoodEstimated Value: $534,298 - $598,000
3
Beds
1
Bath
1,379
Sq Ft
$410/Sq Ft
Est. Value
About This Home
This home is located at 59 Higgins Rd, Framingham, MA 01701 and is currently estimated at $565,825, approximately $410 per square foot. 59 Higgins Rd is a home located in Middlesex County with nearby schools including Framingham High School, Summit Montessori School, and MetroWest Jewish Day School.
Ownership History
Date
Name
Owned For
Owner Type
Purchase Details
Closed on
Jun 30, 2003
Sold by
Spinney Brian A
Bought by
Pio-Clinton Simone D and Clinton Daniel M
Current Estimated Value
Home Financials for this Owner
Home Financials are based on the most recent Mortgage that was taken out on this home.
Original Mortgage
$230,000
Interest Rate
5.53%
Mortgage Type
Purchase Money Mortgage
Purchase Details
Closed on
Nov 4, 1997
Sold by
Stockiley Zoe J and Stockiley Frank
Bought by
Spinney Brian A
Purchase Details
Closed on
Dec 6, 1990
Sold by
Sullivan William R
Bought by
Nassau Charles W
Create a Home Valuation Report for This Property
The Home Valuation Report is an in-depth analysis detailing your home's value as well as a comparison with similar homes in the area
Home Values in the Area
Average Home Value in this Area
Purchase History
| Date | Buyer | Sale Price | Title Company |
|---|---|---|---|
| Pio-Clinton Simone D | $288,000 | -- | |
| Pio-Clinton Simone D | $288,000 | -- | |
| Spinney Brian A | $138,500 | -- | |
| Spinney Brian A | $138,500 | -- | |
| Nassau Charles W | $127,000 | -- | |
| Nassau Charles W | $127,000 | -- |
Source: Public Records
Mortgage History
| Date | Status | Borrower | Loan Amount |
|---|---|---|---|
| Open | Nassau Charles W | $251,175 | |
| Closed | Pio-Clinton Simone D | $230,000 | |
| Previous Owner | Nassau Charles W | $131,500 |
Source: Public Records
Tax History
| Year | Tax Paid | Tax Assessment Tax Assessment Total Assessment is a certain percentage of the fair market value that is determined by local assessors to be the total taxable value of land and additions on the property. | Land | Improvement |
|---|---|---|---|---|
| 2025 | $5,704 | $477,700 | $263,400 | $214,300 |
| 2024 | $5,487 | $440,400 | $235,200 | $205,200 |
| 2023 | $5,202 | $397,400 | $209,900 | $187,500 |
| 2022 | $4,893 | $356,100 | $190,500 | $165,600 |
| 2021 | $4,752 | $338,200 | $183,100 | $155,100 |
| 2020 | $4,663 | $311,300 | $166,400 | $144,900 |
| 2019 | $4,577 | $297,600 | $166,400 | $131,200 |
| 2018 | $4,521 | $277,000 | $160,100 | $116,900 |
| 2017 | $4,447 | $266,100 | $155,500 | $110,600 |
| 2016 | $4,328 | $249,000 | $155,500 | $93,500 |
| 2015 | $4,311 | $241,900 | $155,600 | $86,300 |
Source: Public Records
Map
Nearby Homes
Your Personal Tour Guide
Ask me questions while you tour the home.