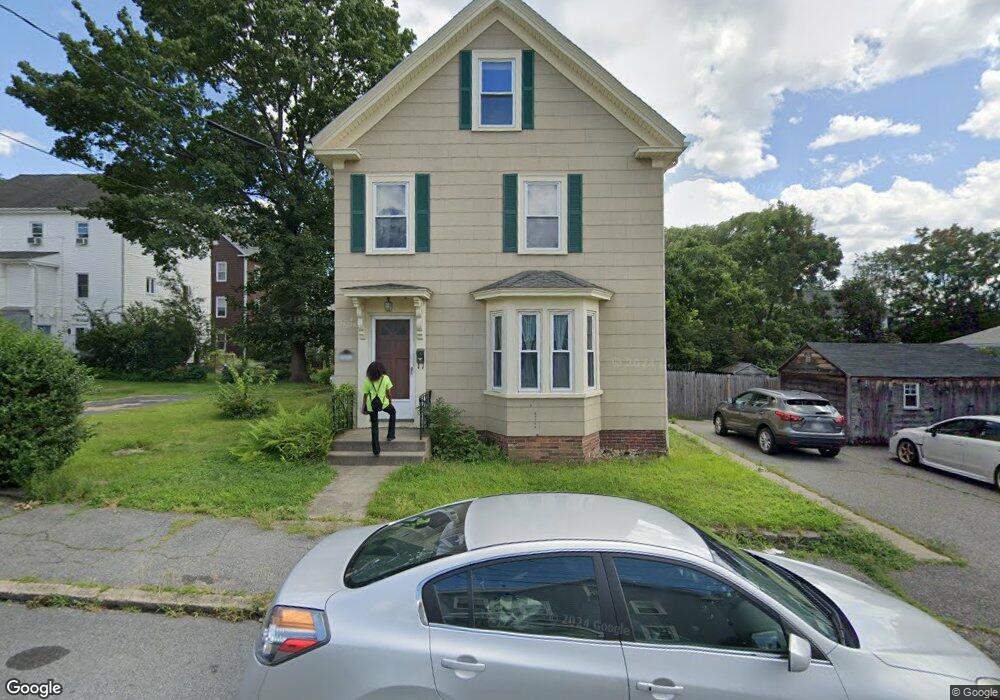
59 High St Woburn, MA 01801
Downtown Woburn NeighborhoodEstimated Value: $713,425 - $890,000
2
Beds
2
Baths
1,941
Sq Ft
$405/Sq Ft
Est. Value
About This Home
This home is located at 59 High St, Woburn, MA 01801 and is currently estimated at $786,606, approximately $405 per square foot. 59 High St is a home located in Middlesex County with nearby schools including Shamrock Elementary School, Daniel L. Joyce Middle School, and Woburn High School.
Ownership History
Date
Name
Owned For
Owner Type
Purchase Details
Closed on
Aug 10, 2017
Sold by
Balestrieri James A and Balestrieri Doreen P
Bought by
Balestrieri Jeremy A
Current Estimated Value
Home Financials for this Owner
Home Financials are based on the most recent Mortgage that was taken out on this home.
Original Mortgage
$360,000
Outstanding Balance
$298,674
Interest Rate
3.75%
Mortgage Type
New Conventional
Estimated Equity
$487,932
Purchase Details
Closed on
Dec 15, 1982
Bought by
Balestrieri James A
Create a Home Valuation Report for This Property
The Home Valuation Report is an in-depth analysis detailing your home's value as well as a comparison with similar homes in the area
Home Values in the Area
Average Home Value in this Area
Purchase History
| Date | Buyer | Sale Price | Title Company |
|---|---|---|---|
| Balestrieri Jeremy A | $480,000 | -- | |
| Balestrieri Jeremy A | $480,000 | -- | |
| Balestrieri James A | -- | -- |
Source: Public Records
Mortgage History
| Date | Status | Borrower | Loan Amount |
|---|---|---|---|
| Open | Balestrieri Jeremy A | $360,000 | |
| Closed | Balestrieri James A | $360,000 | |
| Previous Owner | Balestrieri James A | $152,250 | |
| Previous Owner | Balestrieri James A | $150,000 |
Source: Public Records
Tax History Compared to Growth
Tax History
| Year | Tax Paid | Tax Assessment Tax Assessment Total Assessment is a certain percentage of the fair market value that is determined by local assessors to be the total taxable value of land and additions on the property. | Land | Improvement |
|---|---|---|---|---|
| 2025 | $4,999 | $585,400 | $278,800 | $306,600 |
| 2024 | $4,442 | $551,100 | $265,500 | $285,600 |
| 2023 | $4,475 | $514,400 | $241,400 | $273,000 |
| 2022 | $4,301 | $460,500 | $209,900 | $250,600 |
| 2021 | $0 | $422,400 | $199,900 | $222,500 |
| 2020 | $3,924 | $421,000 | $199,900 | $221,100 |
| 2019 | $28,072 | $406,300 | $190,400 | $215,900 |
| 2018 | $3,620 | $366,000 | $174,600 | $191,400 |
| 2017 | $3,207 | $322,600 | $166,300 | $156,300 |
| 2016 | $3,059 | $304,400 | $155,500 | $148,900 |
| 2015 | $2,942 | $289,300 | $145,300 | $144,000 |
| 2014 | $2,865 | $274,400 | $145,300 | $129,100 |
Source: Public Records
Map
Nearby Homes
- 35 Prospect St Unit 215
- 35 Prospect St Unit 204
- 7 Prospect St
- 62 Jefferson Ave
- 39 Garfield Ave
- 34 Union St
- 2 Eastern Ave
- 69 Eastern Ave
- 477 Main St
- 9 Wade Ave
- 64 Garfield Ave
- 11 Hovey St
- 18 Gardner Ave
- 52 Pleasant St
- 1 Boline Place
- 15 Sturgis St
- 61 Mount Pleasant St
- 21 Franklin St
- 18 Church St Unit 2
- 14 Church Ave
- 55 High St
- 19 Fairmount St
- 17 Fairmount St
- 64 High St
- 53 High St Unit R
- 25 Fairmount St Unit 25
- 25 Fairmount St
- 51 High St Unit A
- 66 High St
- 23 Fairmount St
- 68 High St
- 60 High St
- 58 High St
- 10 Fairmount St
- 10 Fairmount St Unit 2
- 10 Fairmount St Unit 10
- 10 Fairmount St Unit 1
- 65 High St
- 65 High St Unit 1
- 56 High St Unit A