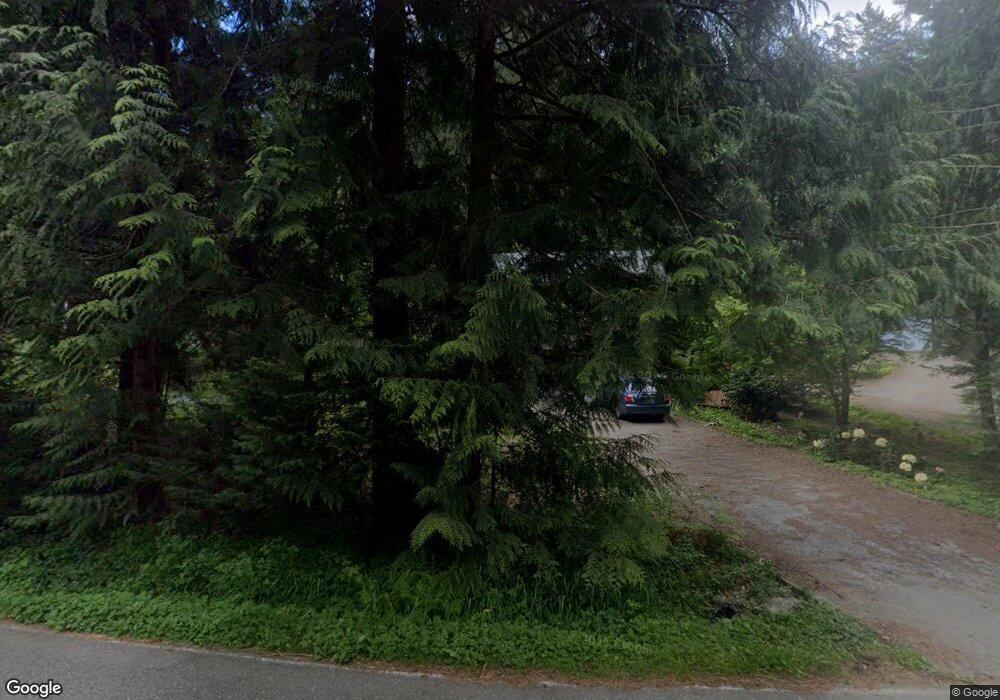
59 Honeycomb Ln Bellingham, WA 98229
Estimated Value: $570,000 - $616,000
3
Beds
3
Baths
1,951
Sq Ft
$305/Sq Ft
Est. Value
About This Home
This home is located at 59 Honeycomb Ln, Bellingham, WA 98229 and is currently estimated at $595,227, approximately $305 per square foot. 59 Honeycomb Ln is a home located in Whatcom County with nearby schools including Geneva Elementary School, Kulshan Middle School, and Bellingham High School.
Ownership History
Date
Name
Owned For
Owner Type
Purchase Details
Closed on
Mar 5, 2005
Sold by
Mehler Michael S and Mehler Pamela F
Bought by
Brightwell Lawrence L and Brightwell Gayle L
Current Estimated Value
Home Financials for this Owner
Home Financials are based on the most recent Mortgage that was taken out on this home.
Original Mortgage
$208,000
Outstanding Balance
$105,800
Interest Rate
5.66%
Mortgage Type
Purchase Money Mortgage
Estimated Equity
$489,427
Purchase Details
Closed on
Jul 21, 2004
Sold by
Kramer Construction Llc
Bought by
M & M Construction
Purchase Details
Closed on
Nov 26, 2002
Sold by
The Borgman Family Trust
Bought by
Kramer Construction Llc
Purchase Details
Closed on
Dec 10, 1999
Sold by
Borgman Charles A
Bought by
Borgman Charles A and Borgman Sandra H
Create a Home Valuation Report for This Property
The Home Valuation Report is an in-depth analysis detailing your home's value as well as a comparison with similar homes in the area
Home Values in the Area
Average Home Value in this Area
Purchase History
| Date | Buyer | Sale Price | Title Company |
|---|---|---|---|
| Brightwell Lawrence L | $260,000 | First American Title Insuran | |
| M & M Construction | $60,000 | Whatcom Land Title | |
| Kramer Construction Llc | -- | Whatcom Land Title | |
| Borgman Charles A | -- | -- |
Source: Public Records
Mortgage History
| Date | Status | Borrower | Loan Amount |
|---|---|---|---|
| Open | Brightwell Lawrence L | $208,000 | |
| Closed | Brightwell Lawrence L | $52,000 |
Source: Public Records
Tax History Compared to Growth
Tax History
| Year | Tax Paid | Tax Assessment Tax Assessment Total Assessment is a certain percentage of the fair market value that is determined by local assessors to be the total taxable value of land and additions on the property. | Land | Improvement |
|---|---|---|---|---|
| 2024 | $4,976 | $570,125 | $134,920 | $435,205 |
| 2023 | $4,976 | $573,607 | $135,744 | $437,863 |
| 2022 | $3,915 | $494,502 | $117,024 | $377,478 |
| 2021 | $3,758 | $358,335 | $84,800 | $273,535 |
| 2020 | $3,749 | $338,052 | $80,000 | $258,052 |
| 2019 | $3,439 | $333,730 | $69,044 | $264,686 |
| 2018 | $3,450 | $313,361 | $64,800 | $248,561 |
| 2017 | $2,911 | $267,794 | $55,350 | $212,444 |
| 2016 | $2,605 | $235,610 | $48,600 | $187,010 |
| 2015 | $2,609 | $220,870 | $46,323 | $174,547 |
| 2014 | -- | $214,562 | $45,000 | $169,562 |
| 2013 | -- | $205,387 | $42,600 | $162,787 |
Source: Public Records
Map
Nearby Homes
- 325 Sudden Valley Dr
- 6 Sugarpine Place
- 8 Morning Glory Dr
- 30 Little Strawberry Ln
- 43 Rocky Ridge Dr
- 46 Sudden Valley Dr
- 56 Sudden Valley Dr
- 63 Valley Crest Way
- 400 Sudden Valley Dr
- 40 Morning Glory Dr
- 16 Sandalwood Cir
- 3 Louise View Dr
- 15 Sudden Valley Dr
- 21 Clematis Ln
- 1 Valley Crest Way
- 214 Polo Park Dr
- 18 Sweetclover Cir
- 3 Huckleberry Ct Unit B
- 7 Deer Run Ln
- 4 Sweetclover Cir
- 61 Honeycomb Ln
- 57 Honeycomb Ln
- 55 Honeycomb Ln
- 2 Baywood Ct
- 76 Honeycomb Ln
- 72 Honeycomb Ln
- 70 Honeycomb Ln
- 349 Sudden Valley Dr
- 343 Sudden Valley Dr
- 4 Baywood Ct
- 65 Honeycomb Ln
- 86 Honeycomb Ln
- 80 Honeycomb Ln
- 66 Honeycomb Ln
- 67 Honeycomb Ln
- 88 Honeycomb Ln
- 351 Sudden Valley Dr
- 337 Sudden Valley Dr
- 338 Sudden Valley Dr
- 10 Baywood Ct