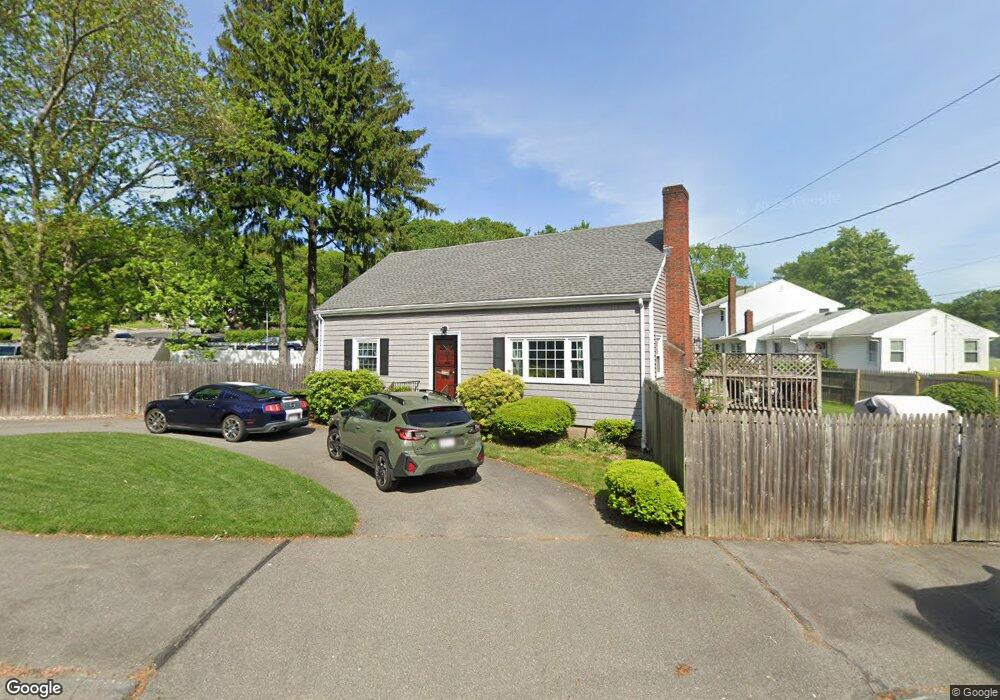
59 Hurd St Lynn, MA 01905
Pine Hill NeighborhoodEstimated Value: $591,000 - $645,960
3
Beds
2
Baths
1,511
Sq Ft
$406/Sq Ft
Est. Value
About This Home
This home is located at 59 Hurd St, Lynn, MA 01905 and is currently estimated at $613,490, approximately $406 per square foot. 59 Hurd St is a home located in Essex County with nearby schools including North Park Elementary School, Sewell-Anderson Elementary School, and William R. Fallon School.
Ownership History
Date
Name
Owned For
Owner Type
Purchase Details
Closed on
Jul 16, 2020
Sold by
Poole Jannel M
Bought by
Janvrin Andrew L and Poole Jannel M
Current Estimated Value
Home Financials for this Owner
Home Financials are based on the most recent Mortgage that was taken out on this home.
Original Mortgage
$227,000
Outstanding Balance
$200,389
Interest Rate
3.1%
Mortgage Type
New Conventional
Estimated Equity
$413,101
Purchase Details
Closed on
Apr 29, 2009
Sold by
Wilkinson Alexander
Bought by
Poole Jannel M
Home Financials for this Owner
Home Financials are based on the most recent Mortgage that was taken out on this home.
Original Mortgage
$170,555
Interest Rate
4.86%
Mortgage Type
Purchase Money Mortgage
Purchase Details
Closed on
Jun 14, 2006
Sold by
Tobin John E and Tobin Sandra M
Bought by
Wilkinson Alexander
Purchase Details
Closed on
Jul 22, 1999
Sold by
Pell Barbara H and Kent Douglas J
Bought by
Tobin Sandra M
Create a Home Valuation Report for This Property
The Home Valuation Report is an in-depth analysis detailing your home's value as well as a comparison with similar homes in the area
Home Values in the Area
Average Home Value in this Area
Purchase History
| Date | Buyer | Sale Price | Title Company |
|---|---|---|---|
| Janvrin Andrew L | -- | None Available | |
| Janvrin Andrew L | -- | None Available | |
| Poole Jannel M | $221,500 | -- | |
| Poole Jannel M | $221,500 | -- | |
| Wilkinson Alexander | $334,000 | -- | |
| Wilkinson Alexander | $334,000 | -- | |
| Tobin Sandra M | $160,000 | -- | |
| Tobin Sandra M | $160,000 | -- |
Source: Public Records
Mortgage History
| Date | Status | Borrower | Loan Amount |
|---|---|---|---|
| Open | Janvrin Andrew L | $227,000 | |
| Closed | Janvrin Andrew L | $227,000 | |
| Previous Owner | Tobin Sandra M | $170,555 | |
| Previous Owner | Tobin Sandra M | $44,300 |
Source: Public Records
Tax History Compared to Growth
Tax History
| Year | Tax Paid | Tax Assessment Tax Assessment Total Assessment is a certain percentage of the fair market value that is determined by local assessors to be the total taxable value of land and additions on the property. | Land | Improvement |
|---|---|---|---|---|
| 2025 | $5,935 | $572,900 | $215,800 | $357,100 |
| 2024 | $5,637 | $535,300 | $205,400 | $329,900 |
| 2023 | $5,536 | $496,500 | $206,300 | $290,200 |
| 2022 | $5,483 | $441,100 | $172,200 | $268,900 |
| 2021 | $4,980 | $382,200 | $150,300 | $231,900 |
| 2020 | $4,786 | $357,200 | $138,500 | $218,700 |
| 2019 | $4,841 | $338,500 | $130,900 | $207,600 |
| 2018 | $4,796 | $316,600 | $138,000 | $178,600 |
| 2017 | $4,483 | $287,400 | $120,000 | $167,400 |
| 2016 | $4,331 | $267,700 | $113,800 | $153,900 |
| 2015 | $4,286 | $255,900 | $120,000 | $135,900 |
Source: Public Records
Map
Nearby Homes
- 15 Quebec Ct
- 27 Bradford Terrace
- 14 Atkinson St
- 11 Linwood Rd
- 75 Moulton St
- 93 Robinson St
- 75 Grove St
- 25 Bulfinch St
- 268 Walnut St
- 49 Cowdrey Ave
- 40 Grove St
- 274 Boston St
- 10 Carnes St
- 447 Boston St
- 200 Locust St Unit 504
- 200 Locust St Unit 302
- 358 Broadway Unit 13
- 64 Bacheller St
- 100 Magnolia Ave Unit 5
- 100 Magnolia Ave Unit 4