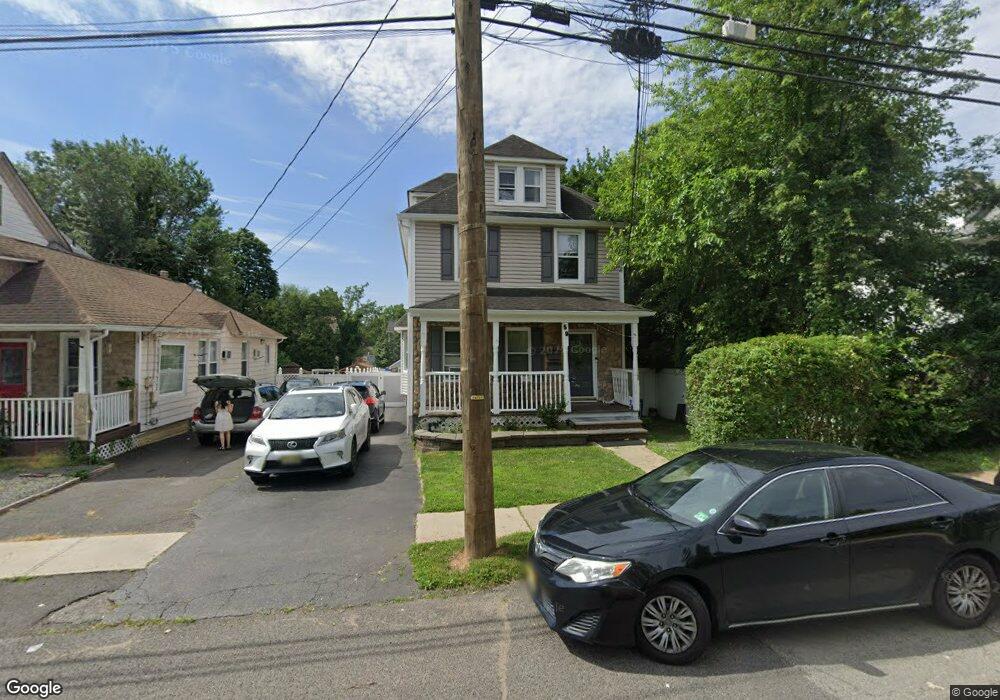
59 Larch Ave Dumont, NJ 07628
Estimated Value: $701,379 - $774,000
--
Bed
--
Bath
1,774
Sq Ft
$410/Sq Ft
Est. Value
About This Home
This home is located at 59 Larch Ave, Dumont, NJ 07628 and is currently estimated at $726,845, approximately $409 per square foot. 59 Larch Ave is a home located in Bergen County with nearby schools including Dumont High School.
Ownership History
Date
Name
Owned For
Owner Type
Purchase Details
Closed on
Sep 16, 2005
Current Estimated Value
Purchase Details
Closed on
Nov 1, 2004
Sold by
Garcia Olga L
Bought by
Carvajal Olga Lucia
Home Financials for this Owner
Home Financials are based on the most recent Mortgage that was taken out on this home.
Original Mortgage
$375,250
Interest Rate
5.75%
Purchase Details
Closed on
Dec 7, 1999
Sold by
Garcia Jose L and Garcia Joseph
Bought by
Garcia Olga L
Purchase Details
Closed on
Dec 5, 1994
Sold by
Lezette Robert and Lezette Michael
Bought by
Garcia Jose and Garcia Olga
Home Financials for this Owner
Home Financials are based on the most recent Mortgage that was taken out on this home.
Original Mortgage
$176,000
Interest Rate
9%
Create a Home Valuation Report for This Property
The Home Valuation Report is an in-depth analysis detailing your home's value as well as a comparison with similar homes in the area
Home Values in the Area
Average Home Value in this Area
Purchase History
| Date | Buyer | Sale Price | Title Company |
|---|---|---|---|
| -- | -- | -- | |
| Carvajal Olga Lucia | $395,000 | -- | |
| Garcia Olga L | -- | -- | |
| Garcia Jose | $185,500 | -- |
Source: Public Records
Mortgage History
| Date | Status | Borrower | Loan Amount |
|---|---|---|---|
| Previous Owner | Carvajal Olga Lucia | $375,250 | |
| Previous Owner | Garcia Jose | $176,000 |
Source: Public Records
Tax History Compared to Growth
Tax History
| Year | Tax Paid | Tax Assessment Tax Assessment Total Assessment is a certain percentage of the fair market value that is determined by local assessors to be the total taxable value of land and additions on the property. | Land | Improvement |
|---|---|---|---|---|
| 2025 | $13,910 | $709,000 | $306,000 | $403,000 |
| 2024 | $13,568 | $342,200 | $177,500 | $164,700 |
| 2023 | $13,288 | $342,200 | $177,500 | $164,700 |
| 2022 | $13,288 | $342,200 | $177,500 | $164,700 |
| 2021 | $13,223 | $342,200 | $177,500 | $164,700 |
| 2020 | $12,863 | $342,200 | $177,500 | $164,700 |
| 2019 | $12,555 | $342,200 | $177,500 | $164,700 |
| 2018 | $12,299 | $342,200 | $177,500 | $164,700 |
| 2017 | $12,063 | $342,200 | $177,500 | $164,700 |
| 2016 | $11,782 | $342,200 | $177,500 | $164,700 |
| 2015 | $11,512 | $342,200 | $177,500 | $164,700 |
| 2014 | $11,286 | $340,200 | $177,500 | $162,700 |
Source: Public Records
Map
Nearby Homes