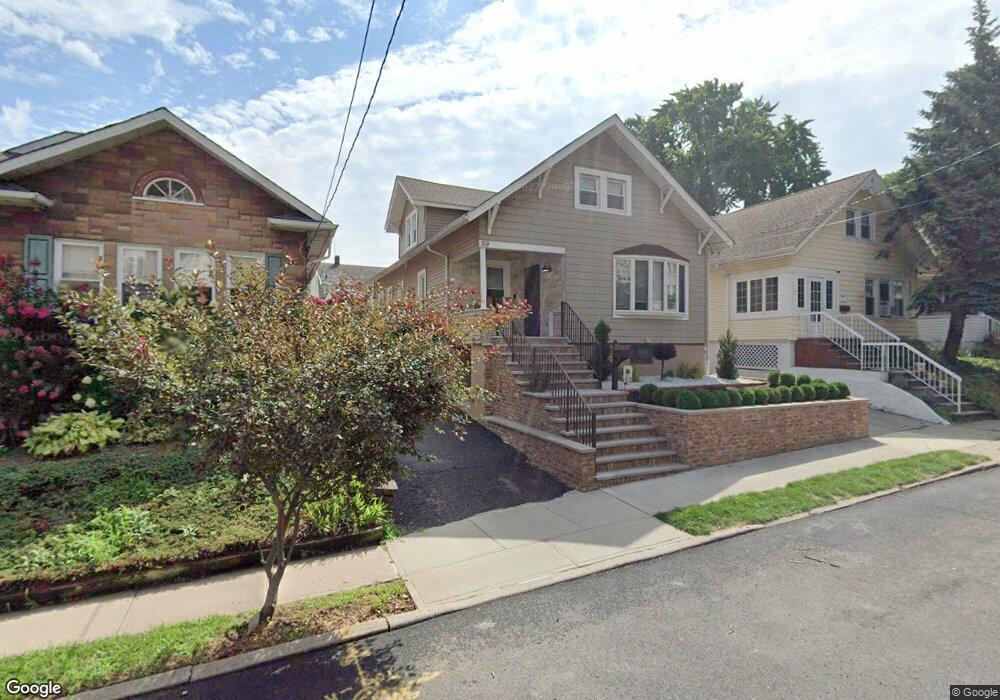
59 Lawrence Ave Staten Island, NY 10310
West Brighton NeighborhoodEstimated Value: $638,667 - $855,000
--
Bed
4
Baths
1,068
Sq Ft
$702/Sq Ft
Est. Value
About This Home
This home is located at 59 Lawrence Ave, Staten Island, NY 10310 and is currently estimated at $749,667, approximately $701 per square foot. 59 Lawrence Ave is a home located in Richmond County with nearby schools including P.S. 45 John Tyler, Is 61 William A Morris, and Curtis High School.
Ownership History
Date
Name
Owned For
Owner Type
Purchase Details
Closed on
Feb 6, 2020
Sold by
Lozovskaya Maria
Bought by
Fox Russell W and Cassano Jenna
Current Estimated Value
Home Financials for this Owner
Home Financials are based on the most recent Mortgage that was taken out on this home.
Original Mortgage
$448,500
Outstanding Balance
$397,115
Interest Rate
3.6%
Mortgage Type
New Conventional
Estimated Equity
$352,552
Purchase Details
Closed on
Jul 21, 2017
Sold by
Lozovskaya Maria and Becerra Jvan
Bought by
Lozovskaya Maria
Home Financials for this Owner
Home Financials are based on the most recent Mortgage that was taken out on this home.
Original Mortgage
$94,393
Interest Rate
3.92%
Mortgage Type
New Conventional
Purchase Details
Closed on
Jun 30, 2010
Sold by
Wettenstein Joan L
Bought by
Lozovskaya Maria and Bacerra Jean
Home Financials for this Owner
Home Financials are based on the most recent Mortgage that was taken out on this home.
Original Mortgage
$308,750
Interest Rate
4.63%
Mortgage Type
New Conventional
Create a Home Valuation Report for This Property
The Home Valuation Report is an in-depth analysis detailing your home's value as well as a comparison with similar homes in the area
Home Values in the Area
Average Home Value in this Area
Purchase History
| Date | Buyer | Sale Price | Title Company |
|---|---|---|---|
| Fox Russell W | $575,000 | Equity Settlement Svcs In | |
| Lozovskaya Maria | -- | Thoroughbred Title Services | |
| Lozovskaya Maria | $325,000 | Old Republic National Title |
Source: Public Records
Mortgage History
| Date | Status | Borrower | Loan Amount |
|---|---|---|---|
| Open | Fox Russell W | $448,500 | |
| Previous Owner | Lozovskaya Maria | $94,393 | |
| Previous Owner | Lozovskaya Maria | $308,750 |
Source: Public Records
Tax History Compared to Growth
Tax History
| Year | Tax Paid | Tax Assessment Tax Assessment Total Assessment is a certain percentage of the fair market value that is determined by local assessors to be the total taxable value of land and additions on the property. | Land | Improvement |
|---|---|---|---|---|
| 2025 | $5,849 | $44,400 | $8,385 | $36,015 |
| 2024 | $5,849 | $39,240 | $8,950 | $30,290 |
| 2023 | $5,580 | $27,475 | $7,565 | $19,910 |
| 2022 | $5,485 | $41,220 | $12,060 | $29,160 |
| 2021 | $5,738 | $35,760 | $12,060 | $23,700 |
| 2020 | $6,097 | $37,920 | $12,060 | $25,860 |
| 2019 | $5,719 | $33,060 | $12,060 | $21,000 |
| 2018 | $4,667 | $22,896 | $8,444 | $14,452 |
| 2017 | $4,667 | $22,896 | $11,563 | $11,333 |
| 2016 | $4,543 | $22,723 | $11,005 | $11,718 |
| 2015 | $3,881 | $21,437 | $10,106 | $11,331 |
| 2014 | $3,881 | $20,224 | $11,441 | $8,783 |
Source: Public Records
Map
Nearby Homes
- 67 Lawrence Ave
- 20 Baker Place
- 605 Bard Ave
- 34 Harvest Ave
- 100 Lawrence Ave
- 145 Norma Place
- 244 Delafield Ave
- 372 Sharon Ave
- 152 Harvest Ave
- 432 Pelton Ave
- 125 Walbrooke Ave
- 1 Whitewood Ave
- 72 Gregg Place
- 112 Delafield Ave
- 1 Sunset Hill Dr
- 215 Hart Blvd Unit 4C
- 215 Hart Blvd Unit 3L
- 58-62 University Place
- 710 Oakland Ave
- 335 Oakland Ave
- 63 Lawrence Ave
- 55 Lawrence Ave
- 38 Morrison Ave
- 218 Hart Ave
- 214 Hart Ave
- 222 Hart Ave
- 71 Lawrence Ave
- 226 Hart Ave
- 24 Morrison Ave Unit 26
- 24-26 Morrison Ave
- 230 Hart Ave
- 75-77 Lawrence Ave
- 75 Lawrence Ave Unit 77
- 41 Lawrence Ave
- 234 Hart Ave
- 48 Morrison Ave
- 81 Lawrence Ave
- 238 Hart Ave
- 37 Lawrence Ave
- 31 Morrison Ave