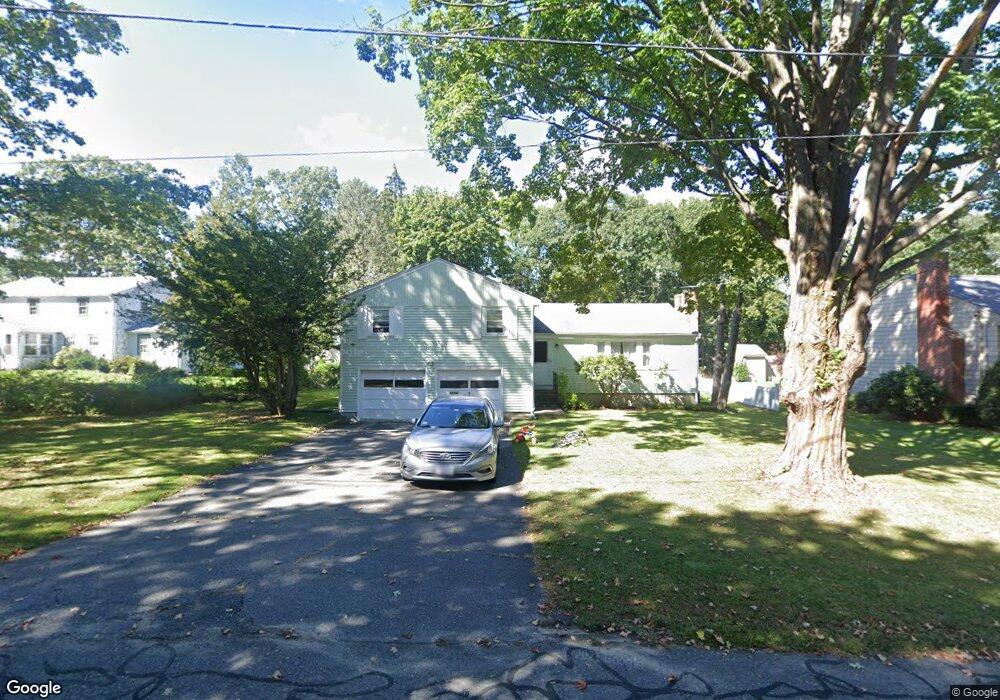
59 Linnea Ln Reading, MA 01867
Estimated Value: $781,000 - $955,000
3
Beds
2
Baths
1,514
Sq Ft
$572/Sq Ft
Est. Value
About This Home
This home is located at 59 Linnea Ln, Reading, MA 01867 and is currently estimated at $865,375, approximately $571 per square foot. 59 Linnea Ln is a home located in Middlesex County with nearby schools including J. Warren Killam Elementary School, Arthur W. Coolidge Middle School, and Reading Memorial High School.
Ownership History
Date
Name
Owned For
Owner Type
Purchase Details
Closed on
May 27, 2011
Sold by
Hodgkins
Bought by
Zhang Qiang and Yu Jiefei
Current Estimated Value
Home Financials for this Owner
Home Financials are based on the most recent Mortgage that was taken out on this home.
Original Mortgage
$312,000
Outstanding Balance
$218,189
Interest Rate
4.94%
Mortgage Type
Purchase Money Mortgage
Estimated Equity
$647,186
Create a Home Valuation Report for This Property
The Home Valuation Report is an in-depth analysis detailing your home's value as well as a comparison with similar homes in the area
Home Values in the Area
Average Home Value in this Area
Purchase History
| Date | Buyer | Sale Price | Title Company |
|---|---|---|---|
| Zhang Qiang | $390,000 | -- |
Source: Public Records
Mortgage History
| Date | Status | Borrower | Loan Amount |
|---|---|---|---|
| Open | Zhang Qiang | $312,000 |
Source: Public Records
Tax History Compared to Growth
Tax History
| Year | Tax Paid | Tax Assessment Tax Assessment Total Assessment is a certain percentage of the fair market value that is determined by local assessors to be the total taxable value of land and additions on the property. | Land | Improvement |
|---|---|---|---|---|
| 2025 | $9,462 | $830,700 | $565,700 | $265,000 |
| 2024 | $9,578 | $817,200 | $556,500 | $260,700 |
| 2023 | $9,013 | $715,900 | $487,500 | $228,400 |
| 2022 | $9,002 | $675,300 | $459,900 | $215,400 |
| 2021 | $5,408 | $623,000 | $420,800 | $202,200 |
| 2020 | $8,264 | $592,400 | $400,100 | $192,300 |
| 2019 | $7,922 | $556,700 | $376,000 | $180,700 |
| 2018 | $4,848 | $520,900 | $351,800 | $169,100 |
| 2017 | $7,164 | $510,600 | $344,900 | $165,700 |
| 2016 | $6,595 | $454,800 | $301,100 | $153,700 |
| 2015 | $6,178 | $420,300 | $278,300 | $142,000 |
| 2014 | $5,986 | $406,100 | $268,900 | $137,200 |
Source: Public Records
Map
Nearby Homes
- 11 Clover Cir Unit A
- 0 Charles St Unit 72374573
- 409 Haverhill St
- 863 Main St
- 18 Symonds Way
- 25 Martin Rd
- 28 Martin Rd
- 8 Partridge Rd
- 42 Winthrop Ave
- 41 Winter St
- 684 Haverhill St
- 33 Marla Ln
- 483 Franklin St
- 195 Lowell St
- 52 Salem St
- 23 Covey Hill Rd
- 52 Sanborn St Unit 408
- 725 Haverhill St
- 23 Governors Dr
- 77 Mount Vernon St