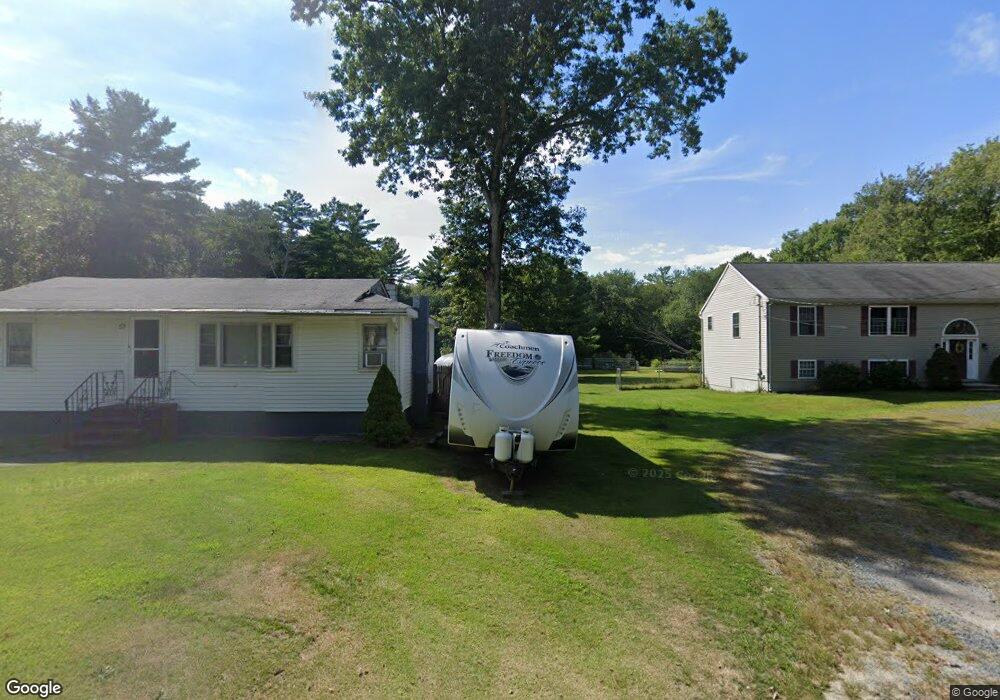
59 Locust St Berkley, MA 02779
Berkley Bridge/Lower Berkley NeighborhoodEstimated Value: $560,000 - $690,055
3
Beds
2
Baths
1,092
Sq Ft
$560/Sq Ft
Est. Value
About This Home
This home is located at 59 Locust St, Berkley, MA 02779 and is currently estimated at $611,014, approximately $559 per square foot. 59 Locust St is a home located in Bristol County with nearby schools including Berkley Community School and Our Lady of Lourdes School.
Ownership History
Date
Name
Owned For
Owner Type
Purchase Details
Closed on
May 21, 1997
Sold by
Legere Ronald J
Bought by
Marshall Stanley S and Marshall Joyd L
Current Estimated Value
Purchase Details
Closed on
Apr 15, 1992
Sold by
Norfolk Holding Corp
Bought by
Legere Ronald
Purchase Details
Closed on
Mar 10, 1987
Sold by
Rivers Richard D
Bought by
Wood Allen H
Create a Home Valuation Report for This Property
The Home Valuation Report is an in-depth analysis detailing your home's value as well as a comparison with similar homes in the area
Home Values in the Area
Average Home Value in this Area
Purchase History
| Date | Buyer | Sale Price | Title Company |
|---|---|---|---|
| Marshall Stanley S | $160,000 | -- | |
| Legere Ronald | $125,000 | -- | |
| Wood Allen H | $180,000 | -- |
Source: Public Records
Mortgage History
| Date | Status | Borrower | Loan Amount |
|---|---|---|---|
| Open | Wood Allen H | $121,500 | |
| Closed | Wood Allen H | $126,800 |
Source: Public Records
Tax History Compared to Growth
Tax History
| Year | Tax Paid | Tax Assessment Tax Assessment Total Assessment is a certain percentage of the fair market value that is determined by local assessors to be the total taxable value of land and additions on the property. | Land | Improvement |
|---|---|---|---|---|
| 2025 | $59 | $491,000 | $223,900 | $267,100 |
| 2024 | $5,676 | $455,900 | $201,900 | $254,000 |
| 2023 | $5,658 | $428,000 | $201,900 | $226,100 |
| 2022 | $5,533 | $402,400 | $184,000 | $218,400 |
| 2021 | $4,445 | $381,300 | $178,300 | $203,000 |
| 2020 | $5,285 | $363,700 | $165,300 | $198,400 |
| 2019 | $5,183 | $354,000 | $165,300 | $188,700 |
| 2018 | $4,125 | $341,600 | $161,500 | $180,100 |
| 2017 | $2,336 | $333,100 | $173,100 | $160,000 |
| 2016 | $4,694 | $316,300 | $173,100 | $143,200 |
| 2015 | $4,429 | $318,400 | $173,100 | $145,300 |
| 2014 | $4,220 | $329,400 | $182,300 | $147,100 |
Source: Public Records
Map
Nearby Homes