59 Logan Dr Braintree, MA 02184
East Braintree NeighborhoodEstimated Value: $917,000 - $937,000
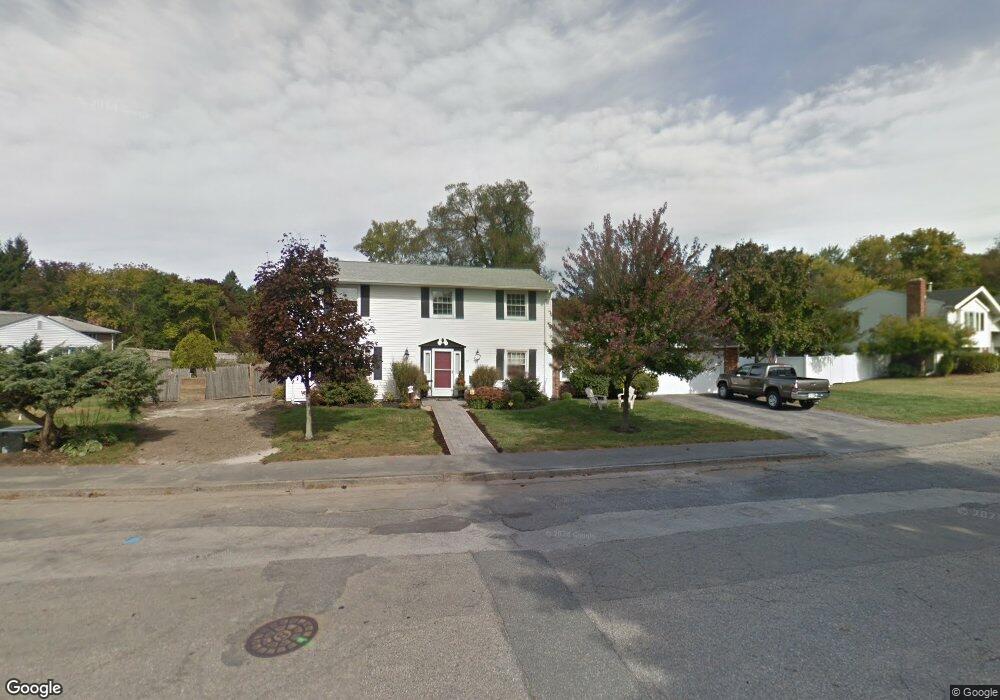
About This Home
This home is located at 59 Logan Dr, Braintree, MA 02184 and is currently estimated at $927,869, approximately $396 per square foot. 59 Logan Dr is a home located in Norfolk County with nearby schools including Braintree High School, Sacred Heart Elementary School, and Step Ahead Kindergarten.
Ownership History
We collect this data history from publicly available records. To have your information removed, we recommend requesting removal directly through your county’s website.
Purchase Details
Home Financials for this Owner
Home Financials are based on the most recent Mortgage that was taken out on this home.Home Values in the Area
Average Home Value in this Area
Purchase History
We collect this data history from publicly available records. To have your information removed, we recommend requesting removal directly through your county’s website.
| Date | Buyer | Sale Price | Title Company |
|---|---|---|---|
| $450,000 | -- |
Mortgage History
We collect this data history from publicly available records. To have your information removed, we recommend requesting removal directly through your county’s website.
| Date | Status | Borrower | Loan Amount |
|---|---|---|---|
| Open | $360,000 |
Tax History
We collect this data history from publicly available records. To have your information removed, we recommend requesting removal directly through your county’s website.
| Year | Tax Paid | Tax Assessment Tax Assessment Total Assessment is a certain percentage of the fair market value that is determined by local assessors to be the total taxable value of land and additions on the property. | Land | Improvement |
|---|---|---|---|---|
| 2025 | $7,862 | $787,800 | $379,100 | $408,700 |
| 2024 | $7,055 | $744,200 | $349,200 | $395,000 |
| 2023 | $6,784 | $695,100 | $319,300 | $375,800 |
| 2022 | $6,519 | $655,200 | $279,400 | $375,800 |
| 2021 | $6,059 | $608,900 | $252,400 | $356,500 |
| 2020 | $5,778 | $586,000 | $229,500 | $356,500 |
| 2019 | $5,635 | $558,500 | $229,500 | $329,000 |
| 2018 | $5,446 | $516,700 | $199,500 | $317,200 |
| 2017 | $5,315 | $494,900 | $189,600 | $305,300 |
| 2016 | $5,155 | $469,500 | $179,600 | $289,900 |
| 2015 | $5,043 | $455,600 | $175,600 | $280,000 |
| 2014 | $4,786 | $419,100 | $152,600 | $266,500 |
Map
- 3 Harrison Ave
- 485 Union St
- 99 Louise Rd
- 27 Sun Valley Dr
- 27 Cindy Ln
- 5 Woodsum Dr Unit 5
- 31-33 Fountain St
- 20 Cherry Ln
- 62 Fountain St
- 115 Pilgrim Rd
- 491 Washington St Unit 1
- 24 Brow Ave
- 55 Hobart Ave
- 296 Commercial St Unit 21
- 51 Faxon St
- 422 John Mahar Hwy Unit 103
- 98 West St
- 38 Stonewood Ln
- 49 Cochato Rd
- 37 Lantern Ln
Ask me questions while you tour the home.