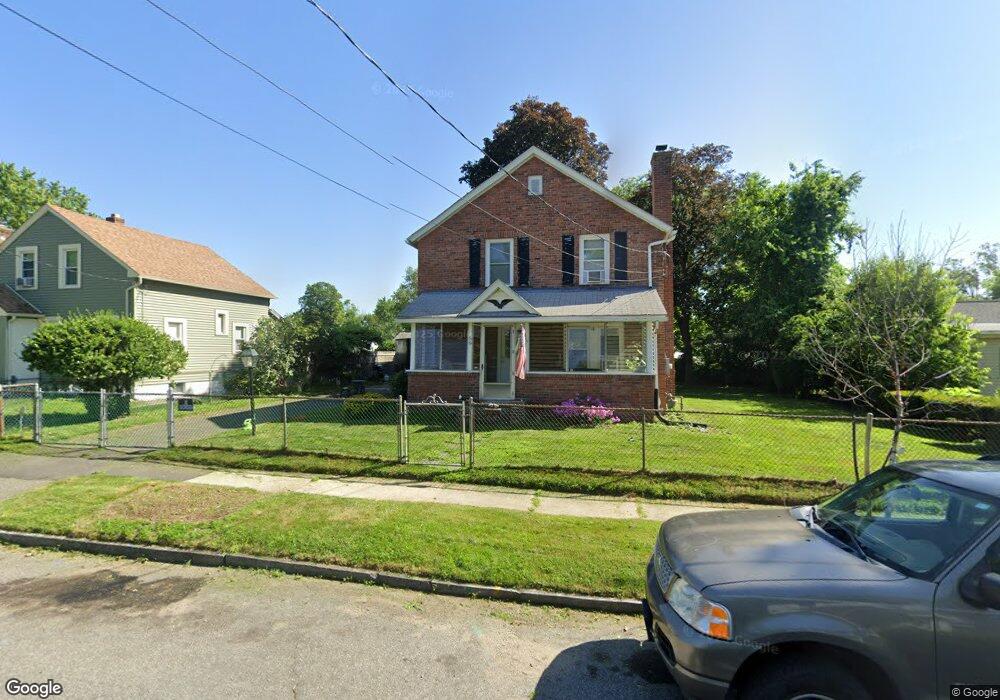
59 Lorimer St Indian Orchard, MA 01151
Indian Orchard NeighborhoodEstimated Value: $277,000 - $307,000
About This Home
This home is located at 59 Lorimer St, Indian Orchard, MA 01151 and is currently estimated at $292,090, approximately $193 per square foot. 59 Lorimer St is a home located in Hampden County with nearby schools including Hiram L. Dorman Elementary, John F. Kennedy Academy, and Springfield Central High School.
Ownership History
We collect this data history from publicly available records. To have your information removed, we recommend requesting removal directly through your county’s website.
Purchase Details
Home Financials for this Owner
Home Financials are based on the most recent Mortgage that was taken out on this home.Purchase Details
Purchase Details
Purchase Details
Home Values in the Area
Average Home Value in this Area
Purchase History
We collect this data history from publicly available records. To have your information removed, we recommend requesting removal directly through your county’s website.
| Date | Buyer | Sale Price | Title Company |
|---|---|---|---|
| $130,000 | -- | ||
| $114,750 | -- | ||
| $109,999 | -- | ||
| $94,900 | -- |
Mortgage History
We collect this data history from publicly available records. To have your information removed, we recommend requesting removal directly through your county’s website.
| Date | Status | Borrower | Loan Amount |
|---|---|---|---|
| Open | $136,000 | ||
| Closed | $26,000 |
Tax History
We collect this data history from publicly available records. To have your information removed, we recommend requesting removal directly through your county’s website.
| Year | Tax Paid | Tax Assessment Tax Assessment Total Assessment is a certain percentage of the fair market value that is determined by local assessors to be the total taxable value of land and additions on the property. | Land | Improvement |
|---|---|---|---|---|
| 2025 | $3,746 | $238,900 | $45,000 | $193,900 |
| 2024 | $3,063 | $190,700 | $42,100 | $148,600 |
| 2023 | $2,945 | $172,700 | $34,500 | $138,200 |
| 2022 | $3,143 | $167,000 | $32,300 | $134,700 |
| 2021 | $2,977 | $157,500 | $29,300 | $128,200 |
| 2020 | $2,760 | $141,300 | $29,300 | $112,000 |
| 2019 | $2,716 | $138,000 | $30,400 | $107,600 |
| 2018 | $2,521 | $128,100 | $30,400 | $97,700 |
| 2017 | $2,463 | $125,300 | $25,800 | $99,500 |
| 2016 | $2,229 | $113,400 | $25,800 | $87,600 |
| 2015 | $2,268 | $115,300 | $25,800 | $89,500 |
Map
- 21 Fullerton St
- 39 Wakefield St
- 81-83 Blanding St
- 81 Arey St
- 524 Goodwin St
- 110 Darling St
- 27 Dubois St
- 170 Brittany Rd
- 235 Pasco Rd
- 67 Fieldston St
- - Glenwood St
- 63 Hope St
- 70 Shumway St Unit B20
- 70 Shumway St Unit 29
- 1466 Page Blvd
- 42 Berkshire St
- 16 Mobile Home Way
- 16 Pioneer Way
- 26-28 Daniel St
- 16-18 Daniel St
Ask me questions while you tour the home.