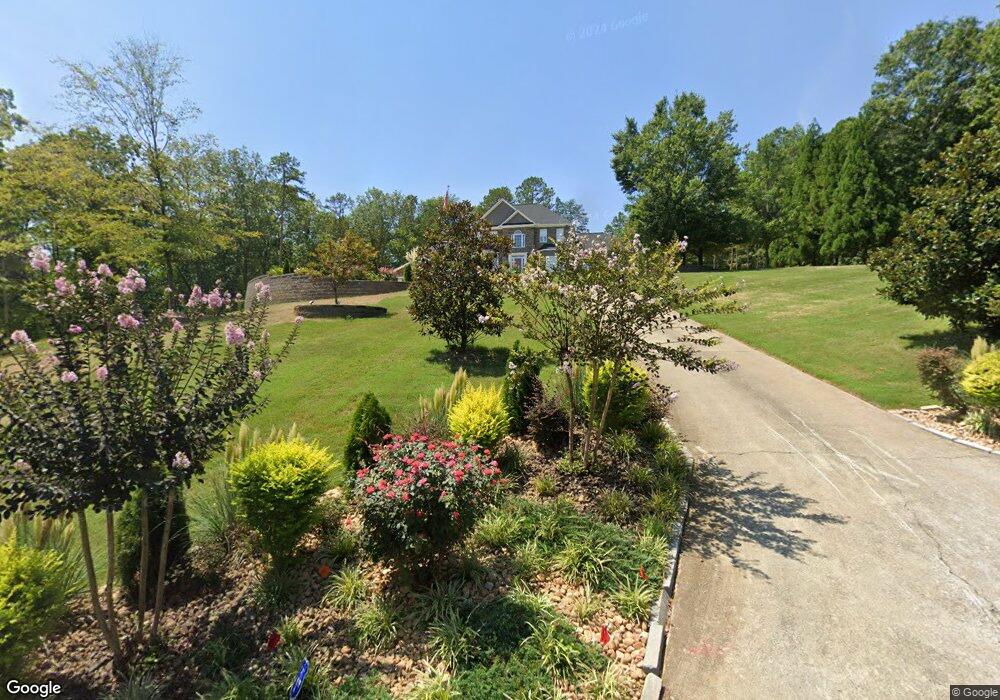
59 Magnolia Ct Summerville, GA 30747
Estimated Value: $469,206 - $536,000
4
Beds
4
Baths
2,628
Sq Ft
$191/Sq Ft
Est. Value
About This Home
This home is located at 59 Magnolia Ct, Summerville, GA 30747 and is currently estimated at $502,302, approximately $191 per square foot. 59 Magnolia Ct is a home located in Chattooga County with nearby schools including Chattooga High School.
Ownership History
Date
Name
Owned For
Owner Type
Purchase Details
Closed on
Aug 18, 2020
Sold by
Finster Guinn Beverly
Bought by
Crowe Linda B
Current Estimated Value
Purchase Details
Closed on
Sep 16, 2016
Sold by
Scott T
Bought by
Finster Guinn Beverly
Home Financials for this Owner
Home Financials are based on the most recent Mortgage that was taken out on this home.
Original Mortgage
$108,850
Interest Rate
3.43%
Mortgage Type
New Conventional
Purchase Details
Closed on
Mar 27, 2006
Sold by
Not Provided
Bought by
Snow Scott T
Home Financials for this Owner
Home Financials are based on the most recent Mortgage that was taken out on this home.
Original Mortgage
$195,000
Interest Rate
6.23%
Mortgage Type
New Conventional
Purchase Details
Closed on
Mar 16, 2005
Sold by
Lanham Eddie
Bought by
Lawson Dempsey and Lawson Sonja M
Create a Home Valuation Report for This Property
The Home Valuation Report is an in-depth analysis detailing your home's value as well as a comparison with similar homes in the area
Home Values in the Area
Average Home Value in this Area
Purchase History
| Date | Buyer | Sale Price | Title Company |
|---|---|---|---|
| Crowe Linda B | $283,000 | -- | |
| Finster Guinn Beverly | $215,000 | -- | |
| Snow Scott T | $195,000 | -- | |
| Lawson Dempsey | -- | -- |
Source: Public Records
Mortgage History
| Date | Status | Borrower | Loan Amount |
|---|---|---|---|
| Previous Owner | Finster Guinn Beverly | $108,850 | |
| Previous Owner | Snow Scott T | $195,000 |
Source: Public Records
Tax History Compared to Growth
Tax History
| Year | Tax Paid | Tax Assessment Tax Assessment Total Assessment is a certain percentage of the fair market value that is determined by local assessors to be the total taxable value of land and additions on the property. | Land | Improvement |
|---|---|---|---|---|
| 2024 | $3,338 | $167,788 | $15,960 | $151,828 |
| 2023 | $3,406 | $169,152 | $21,480 | $147,672 |
| 2022 | $2,887 | $117,848 | $15,910 | $101,938 |
| 2021 | $3,007 | $112,981 | $15,910 | $97,071 |
| 2020 | $2,169 | $79,573 | $7,400 | $72,173 |
| 2019 | $2,225 | $79,573 | $7,400 | $72,173 |
| 2018 | $2,096 | $78,009 | $7,400 | $70,609 |
| 2017 | $2,207 | $78,009 | $7,400 | $70,609 |
| 2016 | $1,822 | $78,009 | $7,400 | $70,609 |
| 2015 | -- | $64,392 | $7,400 | $56,992 |
| 2014 | -- | $64,392 | $7,400 | $56,992 |
| 2013 | -- | $64,392 | $7,400 | $56,992 |
Source: Public Records
Map
Nearby Homes
- 98 Magnolia Ridge
- 6997 Hwy 27
- 1525 Sloppy Floyd Lake Rd
- 47 Taylor St
- 102 Oak St
- 100 Henry Branch Rd
- 562 Highland Ave
- 10117 Commerce St
- 280 Nixon St
- 300 Nixon St
- 16 Bittings Ave
- 755 Highland Ave
- 60 Union St
- 185 Georgia Ave
- 57 N Congress St
- 155 Scoggins St
- 147 Hill St
- 0 Marvin Ave Unit 10301924
- 622 Scoggins St
- 1509/11 Georgia 100
- 95 Magnolia Ct
- 0 Magnolia Ct Unit 7050649
- 0 Magnolia Ct Unit 7050642
- 0 Magnolia Ct Unit 7050323
- 0 Magnolia Ct Unit 26 7362392
- 0 Magnolia Ct Unit 22 7362386
- 0 Magnolia Ct Unit 19 7362369
- 0 Magnolia Ct Unit 1 7361773
- 0 Magnolia Ct Unit 1398157
- 0 Magnolia Ct Unit 1219231
- 0 Magnolia Ct Unit 1256047
- 0 Magnolia Ct Unit 1256043
- 0 Magnolia Ct Unit 1256045
- 62 Magnolia Ct
- 92 Magnolia Ct
- 92 Magnolia Ct Unit 3
- 129 Magnolia Ct
- 8118 Highway 27
- 161 Pleasant Hill Baptist Church Rd
- 315 Pleasant Hill Baptist Church Rd