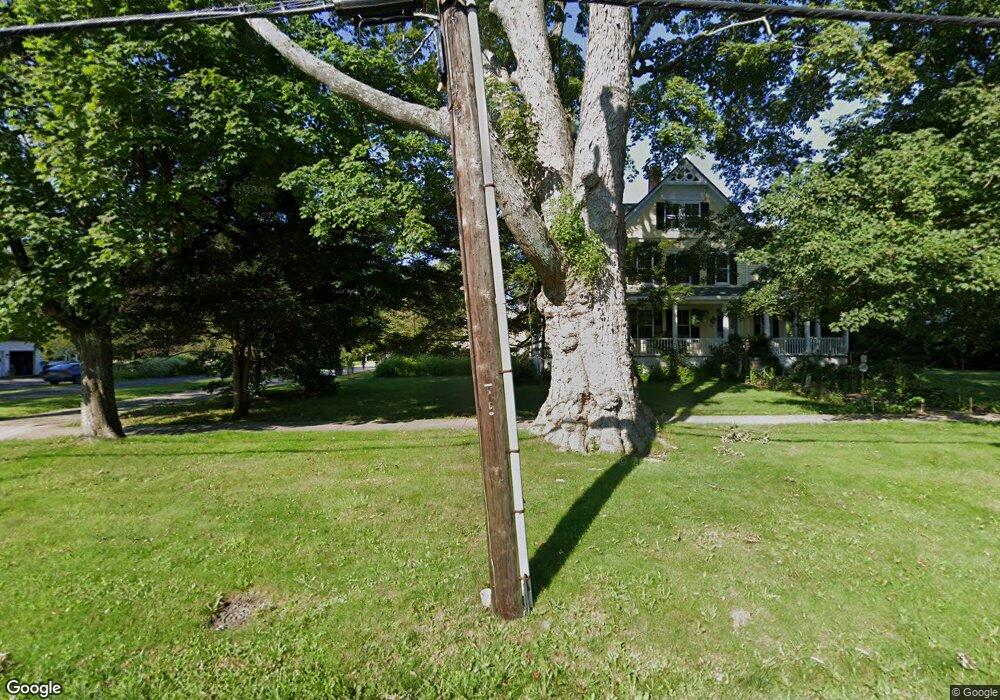
59 Main St Ridgefield, CT 06877
Estimated Value: $2,116,389 - $2,261,000
5
Beds
5
Baths
4,022
Sq Ft
$547/Sq Ft
Est. Value
About This Home
This home is located at 59 Main St, Ridgefield, CT 06877 and is currently estimated at $2,198,097, approximately $546 per square foot. 59 Main St is a home located in Fairfield County with nearby schools including Veterans Park Elementary School, Ridgefield High School, and St. Mary School.
Ownership History
Date
Name
Owned For
Owner Type
Purchase Details
Closed on
Jun 6, 2011
Sold by
Biehl Michael T and Biehl Vicki J
Bought by
Doyle Dvid J and Custode Pamela A
Current Estimated Value
Purchase Details
Closed on
Nov 18, 1998
Sold by
Rottenberg Rana F
Bought by
Biehl Michael T and Biehl Vicki J
Purchase Details
Closed on
Jan 9, 1989
Sold by
King Graham
Bought by
Rottenberg Rana
Create a Home Valuation Report for This Property
The Home Valuation Report is an in-depth analysis detailing your home's value as well as a comparison with similar homes in the area
Home Values in the Area
Average Home Value in this Area
Purchase History
We collect this data history from publicly available records. To have your information removed, we recommend requesting removal directly through your county’s website.
| Date | Buyer | Sale Price | Title Company |
|---|---|---|---|
| Doyle Dvid J | $1,120,000 | -- | |
| Biehl Michael T | $940,000 | -- | |
| Rottenberg Rana | $830,000 | -- |
Source: Public Records
Mortgage History
We collect this data history from publicly available records. To have your information removed, we recommend requesting removal directly through your county’s website.
| Date | Status | Borrower | Loan Amount |
|---|---|---|---|
| Previous Owner | Rottenberg Rana | $250,000 | |
| Previous Owner | Rottenberg Rana | $250,000 |
Source: Public Records
Tax History
| Year | Tax Paid | Tax Assessment Tax Assessment Total Assessment is a certain percentage of the fair market value that is determined by local assessors to be the total taxable value of land and additions on the property. | Land | Improvement |
|---|---|---|---|---|
| 2025 | $30,280 | $1,105,510 | $606,690 | $498,820 |
| 2024 | $29,130 | $1,105,510 | $606,690 | $498,820 |
| 2023 | $28,533 | $1,105,510 | $606,690 | $498,820 |
| 2022 | $25,758 | $906,010 | $410,390 | $495,620 |
| 2021 | $25,559 | $906,010 | $410,390 | $495,620 |
| 2020 | $25,477 | $906,010 | $410,390 | $495,620 |
| 2019 | $25,477 | $906,010 | $410,390 | $495,620 |
| 2018 | $25,169 | $906,010 | $410,390 | $495,620 |
| 2017 | $25,122 | $923,270 | $442,040 | $481,230 |
| 2016 | $24,642 | $923,270 | $442,040 | $481,230 |
| 2015 | $24,014 | $923,270 | $442,040 | $481,230 |
| 2014 | $24,014 | $923,270 | $442,040 | $481,230 |
Source: Public Records
Map
Nearby Homes
- 36 Hayes Ln
- 398 Wilton Rd W
- 371 Wilton Rd W
- 58 High Ridge Ave
- 61 High Ridge Ave
- 94 Soundview Rd
- 21 Branchville Rd
- 236 & 250 Main St
- 36 Golf Ln
- 41 Peaceable St
- 452 Silver Spring Rd
- 0 Salem Rd S Unit 24163261
- 30 Whipstick Rd
- 323 Main St
- 15 Serfillippi Dr
- 12 Holmes Rd
- 36 Catoonah St Unit 18
- 324 Silver Spring Rd
- 19 Prospect Ridge Unit 27
- 19 Prospect Ridge Unit 14
Your Personal Tour Guide
Ask me questions while you tour the home.