
Seller's Agent in 2013
Sara Syberg
MAS Properties
(317) 750-4214
2 in this area
57 Total Sales


Estimated Value: $201,000 - $242,000
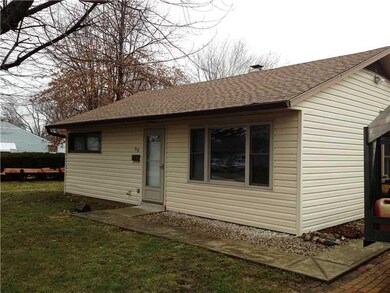
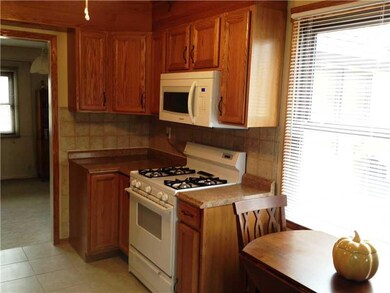
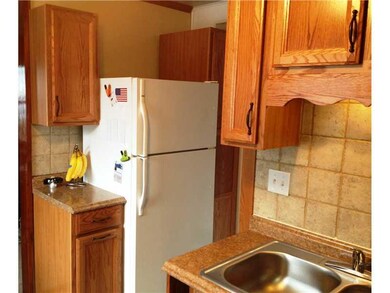
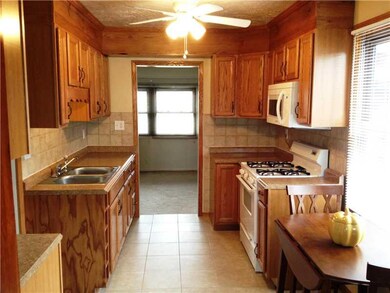
Very well maintained home has lots of updated features. 3 bedroom/2 baths has eat-in totally updated kitchen & laundry room. All appliances stay including front load washer & dryer. Roof/30dimential is 5 yrs old, furnace 3-4 yrs old, water htr-1 yr old, newer windows/siding & plumbed for water softner. LR has beautiful cherry wood walls w/crown moulding. Fully fenced backyard and mini barn. Garage is 2 car w/lots of room for storage/workshop. Located close to Schools, shopping & major highways.
Last Agent to Sell the Property
MAS Properties License #RB14045728 Listed on: 03/18/2013
Last Buyer's Agent
Gloria Hall
Gloria J Bodily-Hall
| Date | Event | Price | List to Sale | Price per Sq Ft |
|---|---|---|---|---|
| 07/26/2013 07/26/13 | Sold | $85,000 | -3.4% | $64 / Sq Ft |
| 06/19/2013 06/19/13 | Pending | -- | -- | -- |
| 06/06/2013 06/06/13 | Price Changed | $88,000 | -4.3% | $67 / Sq Ft |
| 03/18/2013 03/18/13 | For Sale | $92,000 | -- | $70 / Sq Ft |
| Year | Tax Paid | Tax Assessment Tax Assessment Total Assessment is a certain percentage of the fair market value that is determined by local assessors to be the total taxable value of land and additions on the property. | Land | Improvement |
|---|---|---|---|---|
| 2025 | $1,535 | $192,100 | $42,000 | $150,100 |
| 2024 | $1,535 | $161,700 | $42,000 | $119,700 |
| 2023 | $1,490 | $155,000 | $42,000 | $113,000 |
| 2022 | $1,462 | $143,400 | $35,000 | $108,400 |
| 2021 | $1,236 | $126,800 | $35,000 | $91,800 |
| 2020 | $799 | $97,700 | $27,200 | $70,500 |
| 2019 | $680 | $89,900 | $20,700 | $69,200 |
| 2018 | $667 | $88,000 | $17,500 | $70,500 |
| 2017 | $659 | $87,100 | $17,500 | $69,600 |
| 2016 | $502 | $79,300 | $17,500 | $61,800 |
| 2014 | $491 | $74,300 | $17,600 | $56,700 |
| 2013 | $491 | $75,700 | $17,600 | $58,100 |
Seller's Agent in 2013
Sara Syberg
MAS Properties
(317) 750-4214
2 in this area
57 Total Sales
M
Seller Co-Listing Agent in 2013
Mark Syberg
MAS Properties
(317) 750-4214
2 in this area
32 Total Sales
G
Buyer's Agent in 2013
Gloria Hall
Gloria J Bodily-Hall
Source: MIBOR Broker Listing Cooperative®
MLS Number: 21221283
APN: 41-05-21-034-087.000-028
Disclaimer: Certain information contained herein is derived from information provided by parties other than Homes.com. All information provided is deemed reliable, but is not guaranteed to be accurate and should be independently verified.
![]() Based on information submitted to the MLS GRID. All data is obtained from various sources and may not have been verified by broker or MLS GRID. Supplied Open House Information is subject to change without notice. All information should be independently reviewed and verified for accuracy. Properties may or may not be listed by the office/agent presenting the information. Some IDX listings have been excluded from this website.
Based on information submitted to the MLS GRID. All data is obtained from various sources and may not have been verified by broker or MLS GRID. Supplied Open House Information is subject to change without notice. All information should be independently reviewed and verified for accuracy. Properties may or may not be listed by the office/agent presenting the information. Some IDX listings have been excluded from this website.
Based on information submitted to the MLS GRID
Ask me questions while you tour the home.