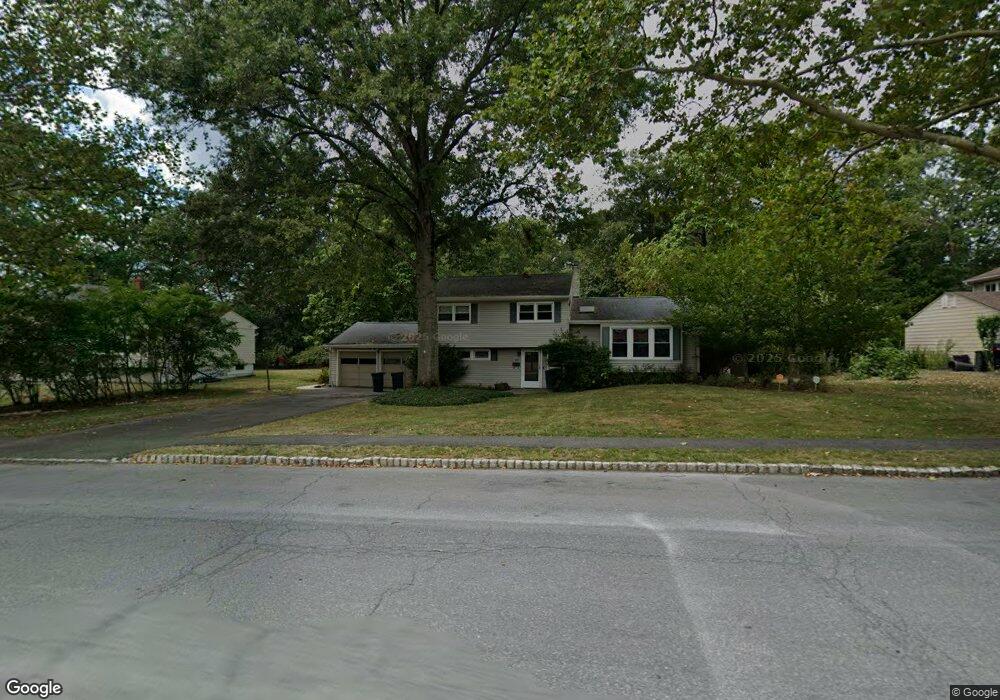
59 Martin Rd Livingston, NJ 07039
Estimated Value: $1,213,000
--
Bed
--
Bath
1,882
Sq Ft
$645/Sq Ft
Est. Value
About This Home
This home is located at 59 Martin Rd, Livingston, NJ 07039 and is currently estimated at $1,213,000, approximately $644 per square foot. 59 Martin Rd is a home located in Essex County with nearby schools including Livingston Sr High School and Aquinas Academy.
Ownership History
Date
Name
Owned For
Owner Type
Purchase Details
Closed on
Mar 8, 1996
Sold by
Auslander Robert
Current Estimated Value
Home Financials for this Owner
Home Financials are based on the most recent Mortgage that was taken out on this home.
Original Mortgage
$207,000
Interest Rate
7.67%
Purchase Details
Closed on
Sep 30, 1994
Sold by
Martin Jean
Bought by
Auslander Robert and Auslander Zelda
Home Financials for this Owner
Home Financials are based on the most recent Mortgage that was taken out on this home.
Original Mortgage
$225,000
Interest Rate
8.5%
Create a Home Valuation Report for This Property
The Home Valuation Report is an in-depth analysis detailing your home's value as well as a comparison with similar homes in the area
Home Values in the Area
Average Home Value in this Area
Purchase History
| Date | Buyer | Sale Price | Title Company |
|---|---|---|---|
| -- | $296,500 | -- | |
| Auslander Robert | $281,250 | -- |
Source: Public Records
Mortgage History
| Date | Status | Borrower | Loan Amount |
|---|---|---|---|
| Previous Owner | -- | $207,000 | |
| Previous Owner | Auslander Robert | $225,000 |
Source: Public Records
Tax History Compared to Growth
Tax History
| Year | Tax Paid | Tax Assessment Tax Assessment Total Assessment is a certain percentage of the fair market value that is determined by local assessors to be the total taxable value of land and additions on the property. | Land | Improvement |
|---|---|---|---|---|
| 2025 | $15,224 | $641,800 | $385,000 | $256,800 |
| 2024 | $15,224 | $641,800 | $385,000 | $256,800 |
| 2022 | $14,973 | $641,800 | $385,000 | $256,800 |
| 2021 | $14,851 | $641,800 | $385,000 | $256,800 |
| 2020 | $14,575 | $641,800 | $385,000 | $256,800 |
| 2019 | $14,040 | $536,700 | $350,000 | $186,700 |
| 2018 | $13,852 | $536,700 | $350,000 | $186,700 |
| 2017 | $13,670 | $536,700 | $350,000 | $186,700 |
| 2016 | $13,418 | $536,700 | $350,000 | $186,700 |
| 2015 | $13,219 | $536,700 | $350,000 | $186,700 |
| 2014 | $12,790 | $536,700 | $350,000 | $186,700 |
Source: Public Records
Map
Nearby Homes