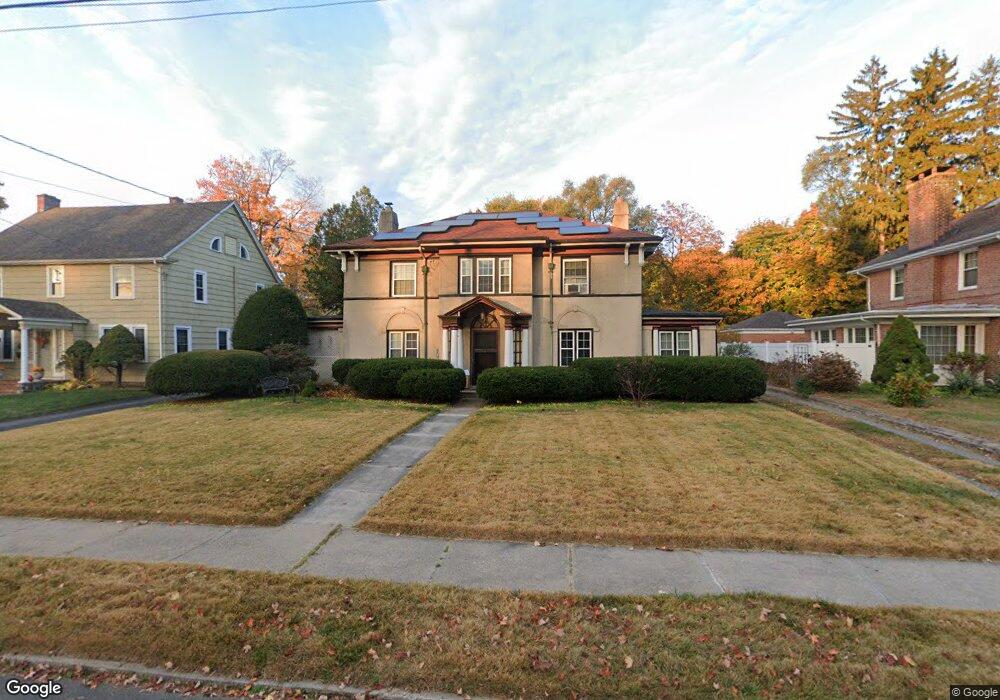
59 Mason Dr New Britain, CT 06052
Estimated Value: $383,279 - $426,000
3
Beds
3
Baths
2,365
Sq Ft
$175/Sq Ft
Est. Value
About This Home
This home is located at 59 Mason Dr, New Britain, CT 06052 and is currently estimated at $412,820, approximately $174 per square foot. 59 Mason Dr is a home located in Hartford County with nearby schools including Vance School, Slade Middle School, and Raymond Hill School.
Ownership History
Date
Name
Owned For
Owner Type
Purchase Details
Closed on
Dec 9, 2014
Sold by
Auidi Richard and Aiudi Melissa M
Bought by
Aiudi Richard S and Aiudi Melissa M
Current Estimated Value
Purchase Details
Closed on
Nov 20, 1990
Sold by
Miller Jeffrey R
Bought by
Aiudi Richard S
Home Financials for this Owner
Home Financials are based on the most recent Mortgage that was taken out on this home.
Original Mortgage
$152,000
Interest Rate
10.03%
Create a Home Valuation Report for This Property
The Home Valuation Report is an in-depth analysis detailing your home's value as well as a comparison with similar homes in the area
Home Values in the Area
Average Home Value in this Area
Purchase History
| Date | Buyer | Sale Price | Title Company |
|---|---|---|---|
| Aiudi Richard S | -- | -- | |
| Aiudi Richard S | $190,000 | -- |
Source: Public Records
Mortgage History
| Date | Status | Borrower | Loan Amount |
|---|---|---|---|
| Previous Owner | Aiudi Richard S | $148,750 | |
| Previous Owner | Aiudi Richard S | $152,000 |
Source: Public Records
Tax History Compared to Growth
Tax History
| Year | Tax Paid | Tax Assessment Tax Assessment Total Assessment is a certain percentage of the fair market value that is determined by local assessors to be the total taxable value of land and additions on the property. | Land | Improvement |
|---|---|---|---|---|
| 2025 | $7,759 | $198,030 | $56,980 | $141,050 |
| 2024 | $7,840 | $198,030 | $56,980 | $141,050 |
| 2023 | $7,581 | $198,030 | $56,980 | $141,050 |
| 2022 | $6,459 | $130,480 | $26,250 | $104,230 |
| 2021 | $6,459 | $130,480 | $26,250 | $104,230 |
| 2020 | $6,589 | $130,480 | $26,250 | $104,230 |
| 2019 | $6,589 | $130,480 | $26,250 | $104,230 |
| 2018 | $6,589 | $130,480 | $26,250 | $104,230 |
| 2017 | $6,748 | $133,630 | $26,740 | $106,890 |
| 2016 | $6,748 | $133,630 | $26,740 | $106,890 |
| 2015 | $6,548 | $133,630 | $26,740 | $106,890 |
| 2014 | $6,548 | $133,630 | $26,740 | $106,890 |
Source: Public Records
Map
Nearby Homes
- 565 Lincoln St
- 73 Brooklawn St
- 423 Monroe St
- 300 Lincoln St
- 100 Shuttle Meadow Ave
- 62 Cedarwood Rd
- 30 Norden St
- 78 Victoria Rd
- 212 Lincoln St
- 256 Hart St
- 17 Kensington Ave
- 305 Lincoln St
- 82 Pond St
- 28 Weigands Dr
- 70 Monroe St
- 93 Winthrop St
- 112 Lincoln St
- 96 Garden St
- 66 Lincoln St
- 239 Glen St Unit 2A