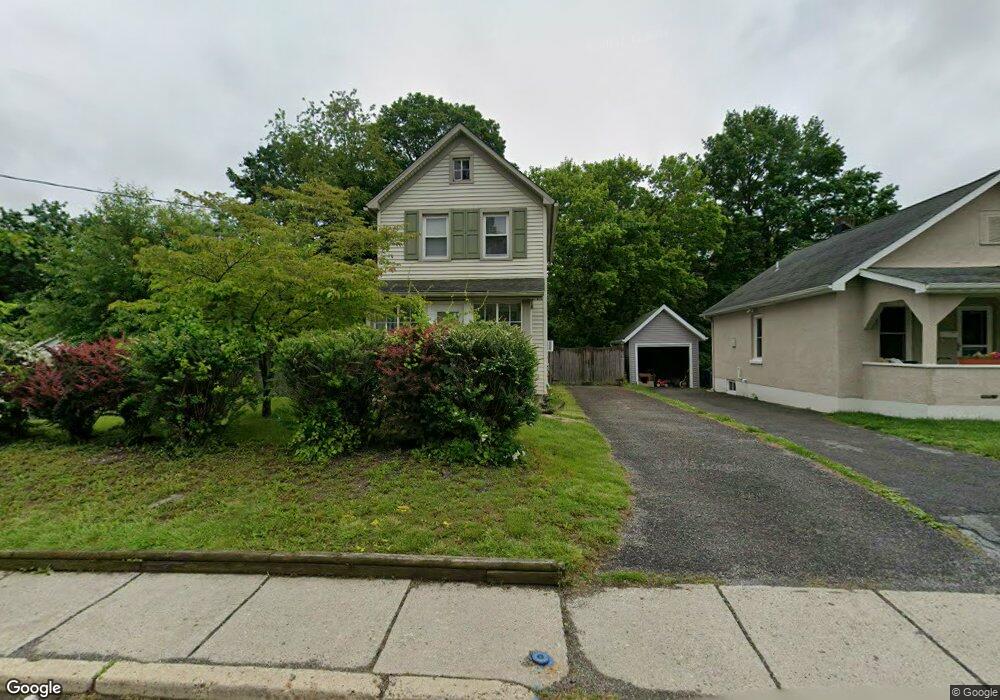
59 Merriam Ave Newton, NJ 07860
Estimated Value: $254,000 - $329,000
--
Bed
--
Bath
812
Sq Ft
$359/Sq Ft
Est. Value
About This Home
This home is located at 59 Merriam Ave, Newton, NJ 07860 and is currently estimated at $291,409, approximately $358 per square foot. 59 Merriam Ave is a home located in Sussex County with nearby schools including Merriam Avenue School, Halsted Street Middle School, and Newton High School.
Ownership History
Date
Name
Owned For
Owner Type
Purchase Details
Closed on
Jun 14, 2004
Sold by
Westview Developers Llc
Bought by
Parasmo Maryann
Current Estimated Value
Purchase Details
Closed on
Dec 20, 2002
Sold by
Dietz Joseph and Dietz Robyn
Bought by
Westview Developers Llc
Purchase Details
Closed on
Oct 15, 1999
Sold by
Malone Kevin A and Malone Pamela J
Bought by
Hud
Create a Home Valuation Report for This Property
The Home Valuation Report is an in-depth analysis detailing your home's value as well as a comparison with similar homes in the area
Home Values in the Area
Average Home Value in this Area
Purchase History
| Date | Buyer | Sale Price | Title Company |
|---|---|---|---|
| Parasmo Maryann | $197,500 | Fidelity National Title Insu | |
| Westview Developers Llc | $135,000 | -- | |
| Hud | -- | -- |
Source: Public Records
Tax History Compared to Growth
Tax History
| Year | Tax Paid | Tax Assessment Tax Assessment Total Assessment is a certain percentage of the fair market value that is determined by local assessors to be the total taxable value of land and additions on the property. | Land | Improvement |
|---|---|---|---|---|
| 2025 | $5,626 | $225,400 | $90,600 | $134,800 |
| 2024 | $5,644 | $206,300 | $74,700 | $131,600 |
| 2023 | $5,644 | $125,600 | $60,400 | $65,200 |
| 2022 | $5,667 | $125,600 | $60,400 | $65,200 |
| 2021 | $5,642 | $125,600 | $60,400 | $65,200 |
| 2020 | $5,555 | $125,600 | $60,400 | $65,200 |
| 2019 | $5,383 | $125,600 | $60,400 | $65,200 |
| 2018 | $5,354 | $125,600 | $60,400 | $65,200 |
| 2017 | $5,323 | $125,600 | $60,400 | $65,200 |
| 2016 | $5,238 | $125,600 | $60,400 | $65,200 |
| 2015 | $5,099 | $125,600 | $60,400 | $65,200 |
| 2014 | $4,994 | $125,600 | $60,400 | $65,200 |
Source: Public Records
Map
Nearby Homes
- 63 Merriam Ave
- 46 Orchard St Unit 2
- 14 Trenton Place
- 46 Pine St
- 103 Woodside Ave
- 8 Orchard St
- 18 Joseph Dr
- 22 Woodside Ave
- 4 Gregg Ct
- 21 Gregg Ct
- 19 Gregg Ct
- 30 Linmor Ave
- 36 Paterson Ave
- 0 W Nelson St
- 9 Lawnwood Ave
- 66 Paterson Ave
- 76 Carriage Ln Unit 76
- 18 Lincoln Place
- 67 Ryerson Ave
- 40 Carriage Ln Unit 40