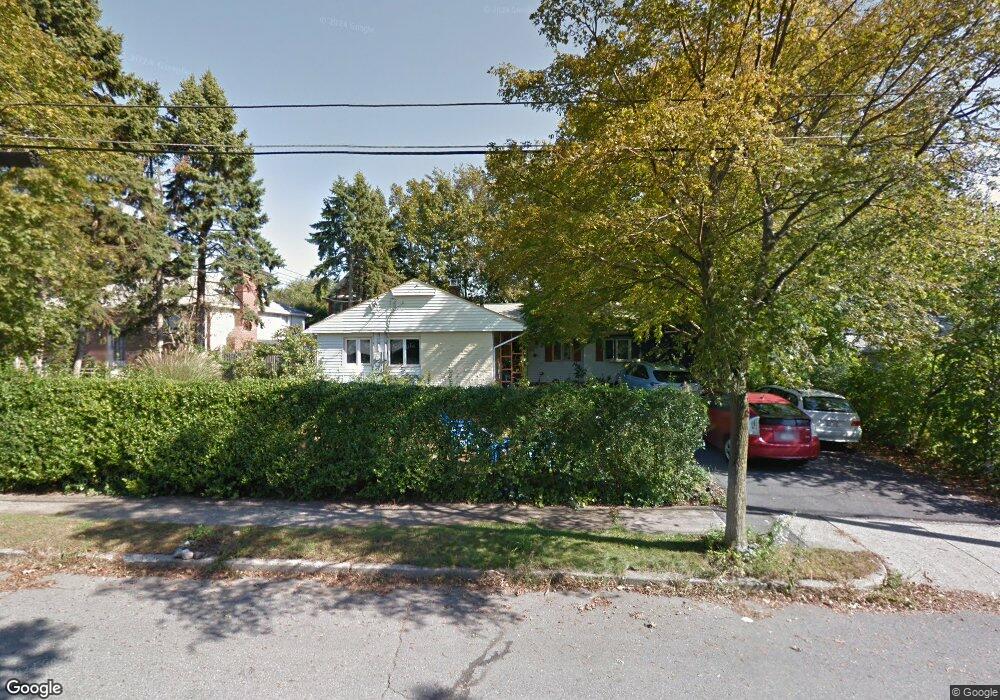
59 Mosman St West Newton, MA 02465
Nonantum NeighborhoodEstimated Value: $1,016,000 - $1,351,000
3
Beds
3
Baths
1,822
Sq Ft
$675/Sq Ft
Est. Value
About This Home
This home is located at 59 Mosman St, West Newton, MA 02465 and is currently estimated at $1,230,461, approximately $675 per square foot. 59 Mosman St is a home located in Middlesex County with nearby schools including Horace Mann Elementary School, F.A. Day Middle School, and Newton North High School.
Ownership History
Date
Name
Owned For
Owner Type
Purchase Details
Closed on
Jun 24, 2020
Sold by
Cohen Sherry M and Armour Ann M
Bought by
T Cohen and Armour T
Current Estimated Value
Purchase Details
Closed on
Sep 22, 1989
Sold by
Schuft Christopher
Bought by
Cohen Sherry M
Create a Home Valuation Report for This Property
The Home Valuation Report is an in-depth analysis detailing your home's value as well as a comparison with similar homes in the area
Home Values in the Area
Average Home Value in this Area
Purchase History
| Date | Buyer | Sale Price | Title Company |
|---|---|---|---|
| T Cohen | -- | None Available | |
| Cohen Sherry M | $195,000 | -- |
Source: Public Records
Mortgage History
| Date | Status | Borrower | Loan Amount |
|---|---|---|---|
| Previous Owner | Cohen Sherry M | $250,000 | |
| Previous Owner | Cohen Sherry M | $52,000 | |
| Previous Owner | Cohen Sherry M | $155,550 |
Source: Public Records
Tax History Compared to Growth
Tax History
| Year | Tax Paid | Tax Assessment Tax Assessment Total Assessment is a certain percentage of the fair market value that is determined by local assessors to be the total taxable value of land and additions on the property. | Land | Improvement |
|---|---|---|---|---|
| 2025 | $9,228 | $941,600 | $837,100 | $104,500 |
| 2024 | $8,923 | $914,200 | $812,700 | $101,500 |
| 2023 | $8,451 | $830,200 | $617,900 | $212,300 |
| 2022 | $8,087 | $768,700 | $572,100 | $196,600 |
| 2021 | $7,803 | $725,200 | $539,700 | $185,500 |
| 2020 | $7,571 | $725,200 | $539,700 | $185,500 |
| 2019 | $7,358 | $704,100 | $524,000 | $180,100 |
| 2018 | $7,002 | $647,100 | $474,700 | $172,400 |
| 2017 | $6,789 | $610,500 | $447,800 | $162,700 |
| 2016 | $5,992 | $526,500 | $418,500 | $108,000 |
| 2015 | $5,713 | $492,100 | $391,100 | $101,000 |
Source: Public Records
Map
Nearby Homes
- 76 Harding St
- 1 Farwell Cir
- 76 Taft Ave Unit 1
- 76 Taft Ave
- 76 Taft Ave Unit 2
- 75 Cherry St
- 177 Nevada St
- 3 Repton Cir Unit 3204
- 176 River St
- 321 Albemarle Rd
- 57 Walnut St
- 354 Linwood Ave Unit 1
- 10 Naviens Ln Unit 2
- 191 Linwood Ave
- 39 Clinton St Unit 2
- 39 Clinton St Unit 1
- 162 Myrtle St Unit 1
- 611 Watertown St Unit 14
- 286 Nevada St Unit 286
- 282 Nevada St Unit 282