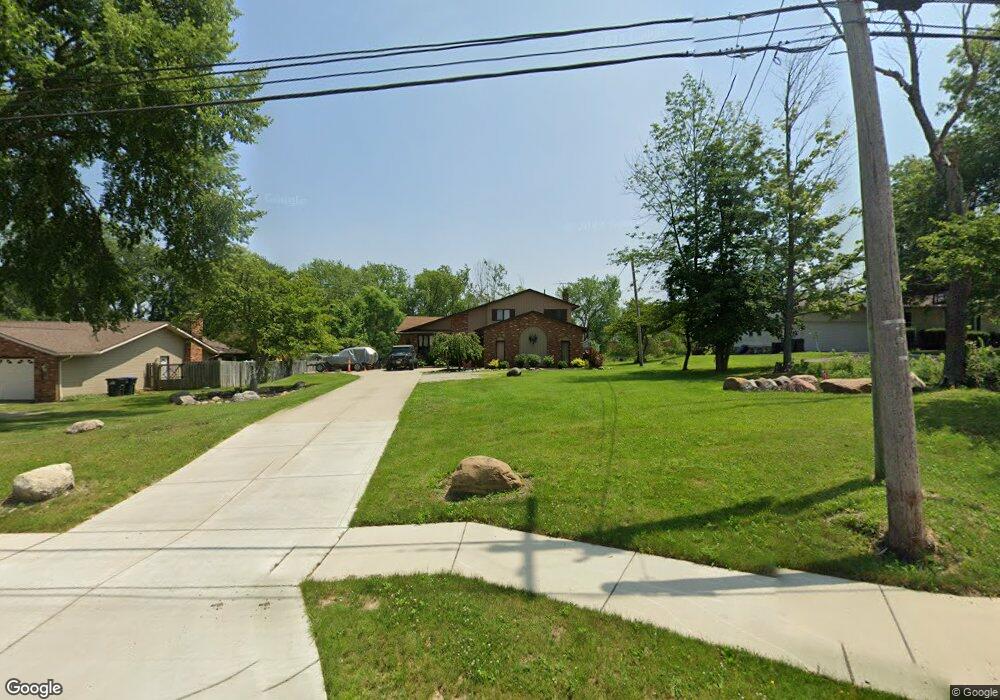
59 N Carpenter Rd Brunswick, OH 44212
Estimated Value: $340,246 - $374,000
3
Beds
3
Baths
2,140
Sq Ft
$169/Sq Ft
Est. Value
About This Home
This home is located at 59 N Carpenter Rd, Brunswick, OH 44212 and is currently estimated at $361,062, approximately $168 per square foot. 59 N Carpenter Rd is a home located in Medina County with nearby schools including Brunswick Memorial Elementary School, Willets Middle School, and Brunswick High School.
Ownership History
Date
Name
Owned For
Owner Type
Purchase Details
Closed on
Jul 30, 2020
Sold by
Clark Jesse
Bought by
Kurek Kevin and Kurek Francesca
Current Estimated Value
Home Financials for this Owner
Home Financials are based on the most recent Mortgage that was taken out on this home.
Original Mortgage
$221,906
Outstanding Balance
$196,772
Interest Rate
3.1%
Mortgage Type
FHA
Estimated Equity
$164,290
Purchase Details
Closed on
Apr 28, 2015
Sold by
Clark Amie R
Bought by
Clark Jesse
Purchase Details
Closed on
Sep 19, 2011
Sold by
Taylor Dorothy
Bought by
Clark Jesse
Home Financials for this Owner
Home Financials are based on the most recent Mortgage that was taken out on this home.
Original Mortgage
$160,115
Interest Rate
4.14%
Mortgage Type
VA
Purchase Details
Closed on
Dec 3, 2010
Sold by
Miles David B
Bought by
Taylor Dorothy
Purchase Details
Closed on
Feb 14, 2008
Sold by
Miles David B and Surv Dorothy M
Bought by
Miles David B
Create a Home Valuation Report for This Property
The Home Valuation Report is an in-depth analysis detailing your home's value as well as a comparison with similar homes in the area
Home Values in the Area
Average Home Value in this Area
Purchase History
| Date | Buyer | Sale Price | Title Company |
|---|---|---|---|
| Kurek Kevin | $226,000 | Guardian Title | |
| Clark Jesse | -- | None Available | |
| Clark Jesse | $155,000 | -- | |
| Hw Jesse Clark | -- | -- | |
| Taylor Dorothy | -- | -- | |
| Miles David B | -- | -- |
Source: Public Records
Mortgage History
| Date | Status | Borrower | Loan Amount |
|---|---|---|---|
| Open | Kurek Kevin | $221,906 | |
| Previous Owner | Hw Jesse Clark | $160,115 |
Source: Public Records
Tax History Compared to Growth
Tax History
| Year | Tax Paid | Tax Assessment Tax Assessment Total Assessment is a certain percentage of the fair market value that is determined by local assessors to be the total taxable value of land and additions on the property. | Land | Improvement |
|---|---|---|---|---|
| 2024 | $4,171 | $77,860 | $23,810 | $54,050 |
| 2023 | $4,171 | $77,860 | $23,810 | $54,050 |
| 2022 | $3,687 | $77,860 | $23,810 | $54,050 |
| 2021 | $3,224 | $61,800 | $18,900 | $42,900 |
| 2020 | $2,901 | $61,800 | $18,900 | $42,900 |
| 2019 | $3,550 | $61,800 | $18,900 | $42,900 |
| 2018 | $2,955 | $53,580 | $15,630 | $37,950 |
| 2017 | $2,959 | $53,580 | $15,630 | $37,950 |
| 2016 | $2,960 | $53,580 | $15,630 | $37,950 |
| 2015 | $2,926 | $50,550 | $14,750 | $35,800 |
| 2014 | $2,755 | $50,550 | $14,750 | $35,800 |
| 2013 | $2,523 | $50,550 | $14,750 | $35,800 |
Source: Public Records
Map
Nearby Homes
- 15604-REAR Boston Rd
- 15772 Boston Rd
- 19740 Benbow Rd
- 19694 Benbow Rd
- 15188 Trails Landing
- 97 Weathervane Ln
- 3137 Blackburn Ln
- 14985 Camden Cir
- 19813 Cross Trail S
- 18987 Laurell Cir
- 16711 Beech Cir
- 106 Briarleigh Dr
- 3003 Alda Pkwy
- 3125 Portsmouth Dr
- 266 Bettie Ln
- 18229 Howe Rd
- 3243 Broadleaf Way
- 3113 Briarcliff Dr
- 3495 Grafton Rd
- 3041 Portsmouth Dr
- 71 N Carpenter Rd
- 39 N Carpenter Rd
- 83 N Carpenter Rd
- 29 N Carpenter Rd
- 56 N Carpenter Rd
- 64 N Carpenter Rd
- 48 N Carpenter Rd
- 72 N Carpenter Rd
- 80 N Carpenter Rd
- 32 N Carpenter Rd
- 19 N Carpenter Rd
- 88 N Carpenter Rd
- 55 Duxbury Ln
- 63 Duxbury Ln
- 49 Duxbury Ln
- 69 Duxbury Ln
- 24 N Carpenter Rd
- 96 N Carpenter Rd
- 77 Duxbury Ln
- N Carpenter Rd