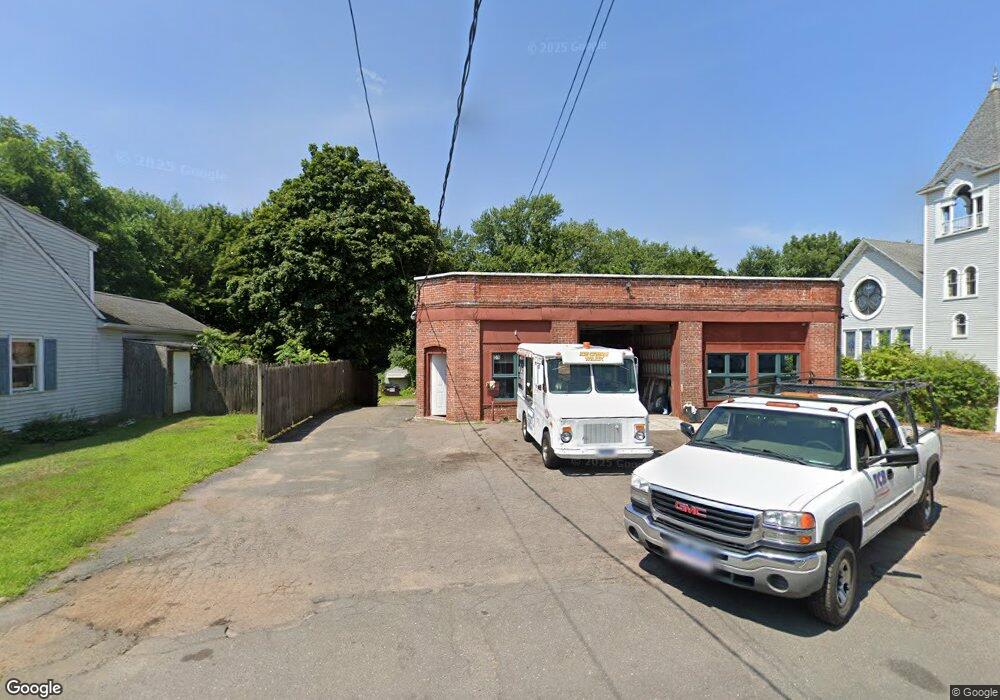
59 N Main St East Windsor, CT 06088
Estimated Value: $141,481
2
Beds
1
Bath
4,731
Sq Ft
$30/Sq Ft
Est. Value
About This Home
This home is located at 59 N Main St, East Windsor, CT 06088 and is currently estimated at $141,481, approximately $29 per square foot. 59 N Main St is a home located in Hartford County with nearby schools including Broad Brook Elementary School, East Windsor Middle School, and East Windsor High School.
Ownership History
Date
Name
Owned For
Owner Type
Purchase Details
Closed on
Jun 5, 2021
Sold by
Carey Florida Prop Llc
Bought by
Jrb Real Estate Llc
Current Estimated Value
Purchase Details
Closed on
Feb 12, 2021
Sold by
Carey Family Realty Llc
Bought by
Carey Florida Prop Llc
Purchase Details
Closed on
Jul 31, 2015
Sold by
Carey Joseph D and Carey Charlton
Bought by
Carey Family Realty Llc
Purchase Details
Closed on
Nov 12, 2013
Sold by
Carey Joseph D
Bought by
Carey Joseph D and Carey Charlton
Create a Home Valuation Report for This Property
The Home Valuation Report is an in-depth analysis detailing your home's value as well as a comparison with similar homes in the area
Home Values in the Area
Average Home Value in this Area
Purchase History
| Date | Buyer | Sale Price | Title Company |
|---|---|---|---|
| Jrb Real Estate Llc | $98,000 | None Available | |
| Jrb Real Estate Llc | $98,000 | None Available | |
| Carey Florida Prop Llc | -- | None Available | |
| Carey Florida Prop Llc | -- | None Available | |
| Carey Family Realty Llc | -- | -- | |
| Carey Family Realty Llc | -- | -- | |
| Carey Joseph D | -- | -- | |
| Carey Joseph D | -- | -- |
Source: Public Records
Tax History Compared to Growth
Tax History
| Year | Tax Paid | Tax Assessment Tax Assessment Total Assessment is a certain percentage of the fair market value that is determined by local assessors to be the total taxable value of land and additions on the property. | Land | Improvement |
|---|---|---|---|---|
| 2025 | $4,227 | $156,380 | $42,850 | $113,530 |
| 2024 | $4,091 | $156,380 | $42,850 | $113,530 |
| 2023 | $4,634 | $126,670 | $52,850 | $73,820 |
| 2022 | $4,602 | $126,670 | $52,850 | $73,820 |
| 2021 | $4,611 | $126,670 | $52,850 | $73,820 |
| 2020 | $4,613 | $126,670 | $52,850 | $73,820 |
| 2019 | $4,516 | $126,670 | $52,850 | $73,820 |
| 2018 | $4,471 | $126,670 | $52,850 | $73,820 |
| 2017 | $4,543 | $133,340 | $52,860 | $80,480 |
| 2016 | $4,284 | $133,340 | $52,860 | $80,480 |
| 2015 | $4,042 | $133,340 | $52,860 | $80,480 |
| 2014 | $3,971 | $133,340 | $52,860 | $80,480 |
Source: Public Records
Map
Nearby Homes
- 0 N Water St Unit 24138494
- 0 N Water St Unit 24128295
- 0 N Water St Unit 24128294
- 0 N Water St Unit 24128288
- 0 N Water St
- 143 Bridge St
- 22 Chestnut St Unit 24
- 32 Pleasant Rd
- 66 Center St
- 15 Suffield St
- 59 Elm St
- 14 Seymour Rd
- 114 Elm St
- 32 School St
- 22 Pearl St
- 106 Orchard Hill Dr
- 15 Pearl St
- 190 Elm St
- 15 Dickerman Ave
- 18 Laurel Cir