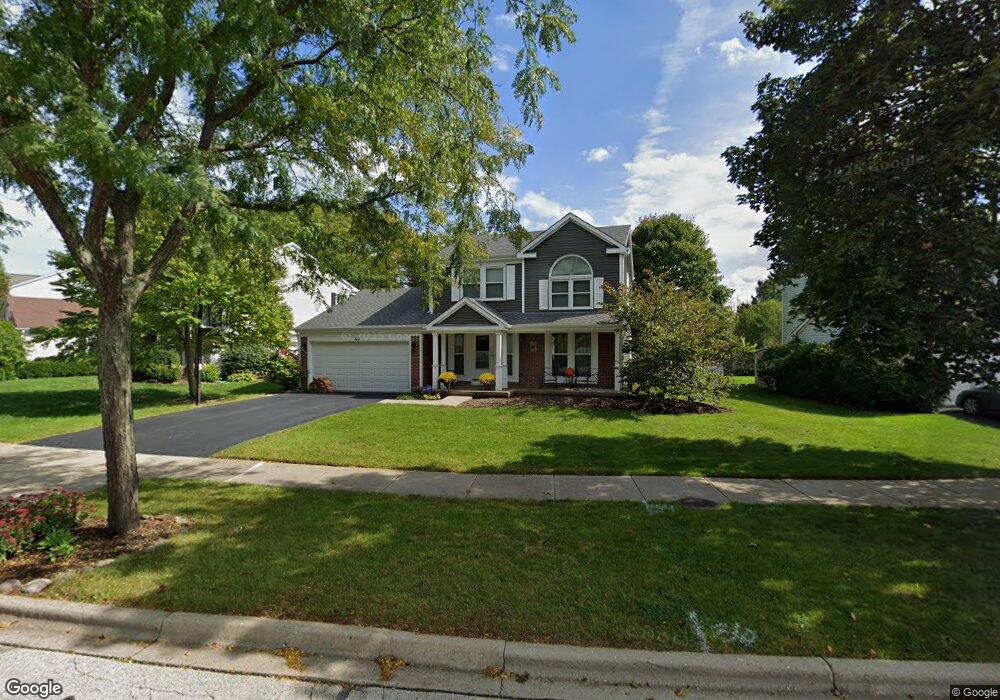
59 N Royal Oak Dr Vernon Hills, IL 60061
Estimated Value: $483,543 - $583,000
--
Bed
3
Baths
1,798
Sq Ft
$300/Sq Ft
Est. Value
About This Home
This home is located at 59 N Royal Oak Dr, Vernon Hills, IL 60061 and is currently estimated at $539,636, approximately $300 per square foot. 59 N Royal Oak Dr is a home located in Lake County with nearby schools including Diamond Lake Elementary School, West Oak Middle School, and Adlai E Stevenson High School.
Ownership History
Date
Name
Owned For
Owner Type
Purchase Details
Closed on
May 20, 2024
Sold by
Dahm David W and Dahm Joan M
Bought by
Dahm Revocable Living Trust and Dahm
Current Estimated Value
Purchase Details
Closed on
Apr 5, 2002
Sold by
Craig Adam and Craig Jennifer
Bought by
Dahm David W and Dahm Joann M
Home Financials for this Owner
Home Financials are based on the most recent Mortgage that was taken out on this home.
Original Mortgage
$160,000
Interest Rate
7.24%
Purchase Details
Closed on
Mar 25, 1998
Sold by
Pettenon Thomas A and Pettenon Rosamond N
Bought by
Craig Adam and Craig Jennifer
Home Financials for this Owner
Home Financials are based on the most recent Mortgage that was taken out on this home.
Original Mortgage
$220,500
Interest Rate
7.27%
Create a Home Valuation Report for This Property
The Home Valuation Report is an in-depth analysis detailing your home's value as well as a comparison with similar homes in the area
Home Values in the Area
Average Home Value in this Area
Purchase History
| Date | Buyer | Sale Price | Title Company |
|---|---|---|---|
| Dahm Revocable Living Trust | -- | None Listed On Document | |
| Dahm David W | $300,000 | -- | |
| Craig Adam | $237,500 | -- |
Source: Public Records
Mortgage History
| Date | Status | Borrower | Loan Amount |
|---|---|---|---|
| Previous Owner | Dahm David W | $160,000 | |
| Previous Owner | Craig Adam | $220,500 |
Source: Public Records
Tax History Compared to Growth
Tax History
| Year | Tax Paid | Tax Assessment Tax Assessment Total Assessment is a certain percentage of the fair market value that is determined by local assessors to be the total taxable value of land and additions on the property. | Land | Improvement |
|---|---|---|---|---|
| 2024 | $12,315 | $132,363 | $35,686 | $96,677 |
| 2023 | $11,350 | $124,894 | $33,672 | $91,222 |
| 2022 | $11,350 | $114,137 | $30,772 | $83,365 |
| 2021 | $10,959 | $112,906 | $30,440 | $82,466 |
| 2020 | $10,810 | $113,291 | $30,544 | $82,747 |
| 2019 | $10,607 | $112,873 | $30,431 | $82,442 |
| 2018 | $11,256 | $120,888 | $30,075 | $90,813 |
| 2017 | $11,126 | $118,066 | $29,373 | $88,693 |
| 2016 | $10,792 | $113,058 | $28,127 | $84,931 |
| 2015 | $10,546 | $105,731 | $26,304 | $79,427 |
| 2014 | $9,707 | $101,702 | $28,250 | $73,452 |
| 2012 | $9,619 | $101,906 | $28,307 | $73,599 |
Source: Public Records
Map
Nearby Homes
- 54 N Royal Oak Dr
- 7215 Daybreak Ln
- 1062 Dearborn Ln
- 67 Shelby Ct
- 126 S Fiore Pkwy
- 291 Hunter Ct
- 820 N Lakeside Dr Unit 2D
- 7271 Providence Ct
- 6722 Indian Ln
- 7267 Providence Ct
- 229 W Court of Shorewood Unit 3B
- 239 W Ct of Shorewood Unit 1B
- 7001 W Meadow Lane Rd
- 349 W Pointe Dr
- 911 Ann Arbor Ln Unit 253
- 717 N Lakeside Dr
- 835 Waterview Cir Unit 4
- 835 Waterview Cir Unit 2
- 713 N Lakeside Dr
- 6421 Collier Cir
- 75 N Royal Oak Dr
- 49 N Royal Oak Dr
- 50 Jansen Ln
- 83 N Royal Oak Dr
- 58 Jansen Ln
- 6 Southfield Dr
- 10 Southfield Dr
- 64 N Royal Oak Dr
- 74 N Royal Oak Dr
- 66 Jansen Ln
- 14 Southfield Dr
- 91 N Royal Oak Dr
- 44 N Royal Oak Dr
- 84 N Royal Oak Dr
- 34 N Royal Oak Dr
- 74 Jansen Ln
- 97 N Royal Oak Dr
- 98 N Royal Oak Dr
- 94 N Royal Oak Dr
- 51 Jansen Ln