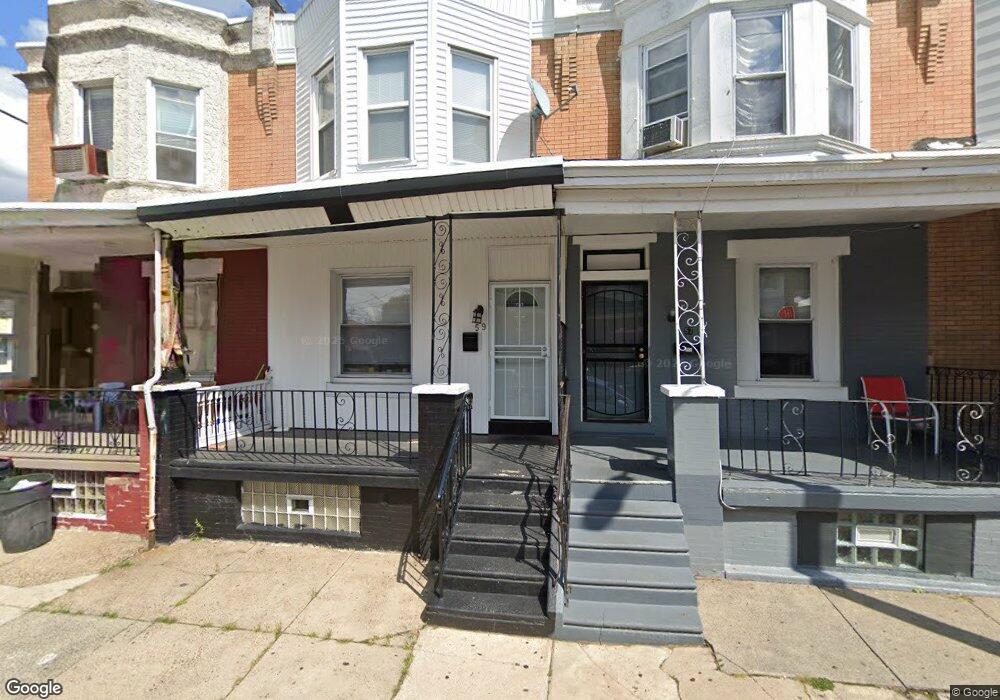
59 N Ruby St Philadelphia, PA 19139
Haddington NeighborhoodEstimated Value: $131,000 - $239,000
3
Beds
1
Bath
1,238
Sq Ft
$142/Sq Ft
Est. Value
About This Home
This home is located at 59 N Ruby St, Philadelphia, PA 19139 and is currently estimated at $175,179, approximately $141 per square foot. 59 N Ruby St is a home located in Philadelphia County with nearby schools including Alain Locke School, West Philadelphia High School, and Global Leadership Academy Charter School Southwest.
Ownership History
Date
Name
Owned For
Owner Type
Purchase Details
Closed on
Dec 27, 2017
Sold by
Cummings Tracey
Bought by
Raza Homes Llc
Current Estimated Value
Purchase Details
Closed on
Dec 18, 2015
Sold by
Murray Fred and Murray Cynthia E
Bought by
Cummings Tracey
Purchase Details
Closed on
Oct 16, 2000
Sold by
Wimberly Patricia M and Imc Mtg Company
Bought by
Murray Fred and Murray Cynthia E
Purchase Details
Closed on
Jul 12, 1996
Sold by
Douglas Frederick and Douglas Loretta
Bought by
Wimberly Patricia M
Create a Home Valuation Report for This Property
The Home Valuation Report is an in-depth analysis detailing your home's value as well as a comparison with similar homes in the area
Home Values in the Area
Average Home Value in this Area
Purchase History
| Date | Buyer | Sale Price | Title Company |
|---|---|---|---|
| Raza Homes Llc | $18,600 | Mba Abstract Inc | |
| Cummings Tracey | $21,500 | None Available | |
| Murray Fred | $20,100 | -- | |
| Wimberly Patricia M | -- | -- |
Source: Public Records
Tax History
| Year | Tax Paid | Tax Assessment Tax Assessment Total Assessment is a certain percentage of the fair market value that is determined by local assessors to be the total taxable value of land and additions on the property. | Land | Improvement |
|---|---|---|---|---|
| 2026 | $1,057 | $101,700 | $20,340 | $81,360 |
| 2025 | $1,057 | $101,700 | $20,340 | $81,360 |
| 2024 | $1,057 | $101,700 | $20,340 | $81,360 |
| 2023 | $1,057 | $75,500 | $15,100 | $60,400 |
| 2022 | $754 | $75,500 | $15,100 | $60,400 |
| 2021 | $755 | $0 | $0 | $0 |
| 2020 | $755 | $0 | $0 | $0 |
| 2019 | $726 | $0 | $0 | $0 |
| 2018 | $613 | $0 | $0 | $0 |
| 2017 | $613 | $0 | $0 | $0 |
| 2016 | $613 | $0 | $0 | $0 |
| 2015 | $820 | $0 | $0 | $0 |
| 2014 | -- | $61,200 | $4,320 | $56,880 |
| 2012 | -- | $6,048 | $971 | $5,077 |
Source: Public Records
Map
Nearby Homes
Your Personal Tour Guide
Ask me questions while you tour the home.