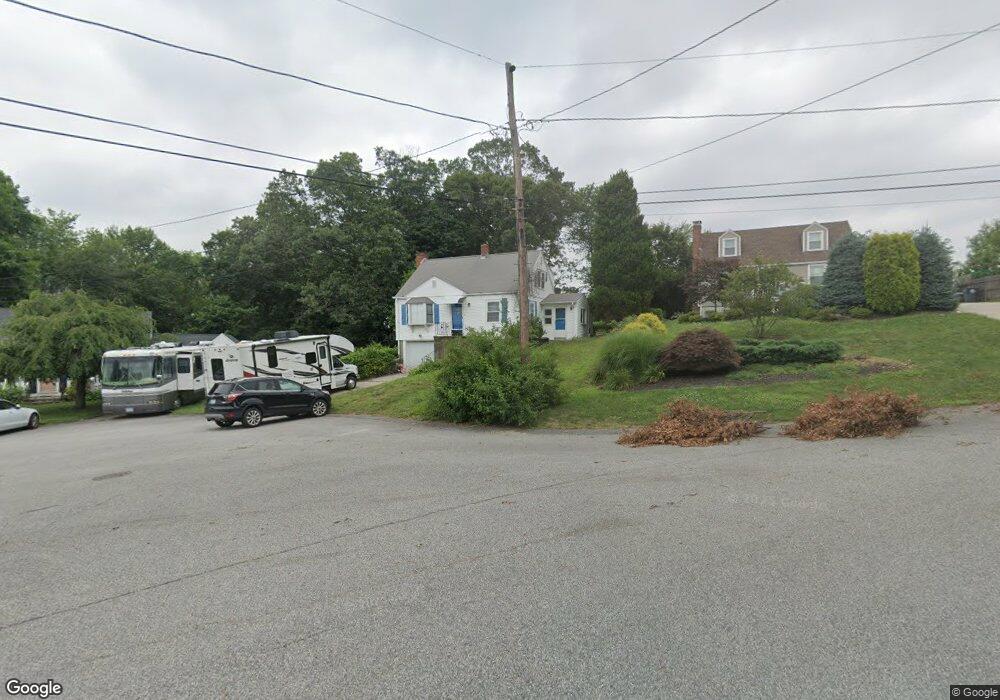
59 Normandy Dr Cranston, RI 02920
Garden Hills NeighborhoodEstimated Value: $432,000 - $463,000
2
Beds
2
Baths
1,152
Sq Ft
$385/Sq Ft
Est. Value
About This Home
This home is located at 59 Normandy Dr, Cranston, RI 02920 and is currently estimated at $443,230, approximately $384 per square foot. 59 Normandy Dr is a home located in Providence County with nearby schools including Glen Hills School, Western Hills Middle School, and Cranston High School West.
Ownership History
Date
Name
Owned For
Owner Type
Purchase Details
Closed on
Mar 28, 2007
Sold by
Kiernan Christopher and Kiernan Lisa
Bought by
Stjohn Renee
Current Estimated Value
Home Financials for this Owner
Home Financials are based on the most recent Mortgage that was taken out on this home.
Original Mortgage
$242,000
Outstanding Balance
$147,040
Interest Rate
6.33%
Mortgage Type
Purchase Money Mortgage
Estimated Equity
$296,190
Purchase Details
Closed on
Apr 10, 2000
Sold by
Marsalek Patrick L and Marsalek Sara
Bought by
Kiernan Christopher J and Smith Lisa M
Home Financials for this Owner
Home Financials are based on the most recent Mortgage that was taken out on this home.
Original Mortgage
$113,900
Interest Rate
8.3%
Purchase Details
Closed on
Dec 17, 1996
Sold by
Dunphy Susan
Bought by
Marsalek Patrick L and Marsalek Sara
Create a Home Valuation Report for This Property
The Home Valuation Report is an in-depth analysis detailing your home's value as well as a comparison with similar homes in the area
Home Values in the Area
Average Home Value in this Area
Purchase History
| Date | Buyer | Sale Price | Title Company |
|---|---|---|---|
| Stjohn Renee | $242,000 | -- | |
| Kiernan Christopher J | $120,000 | -- | |
| Marsalek Patrick L | $105,000 | -- |
Source: Public Records
Mortgage History
| Date | Status | Borrower | Loan Amount |
|---|---|---|---|
| Open | Marsalek Patrick L | $242,000 | |
| Previous Owner | Marsalek Patrick L | $140,000 | |
| Previous Owner | Marsalek Patrick L | $131,000 | |
| Previous Owner | Marsalek Patrick L | $113,900 |
Source: Public Records
Tax History
| Year | Tax Paid | Tax Assessment Tax Assessment Total Assessment is a certain percentage of the fair market value that is determined by local assessors to be the total taxable value of land and additions on the property. | Land | Improvement |
|---|---|---|---|---|
| 2025 | $4,952 | $356,800 | $139,600 | $217,200 |
| 2024 | $4,856 | $356,800 | $139,600 | $217,200 |
| 2023 | $4,844 | $256,300 | $99,800 | $156,500 |
| 2022 | $4,744 | $256,300 | $99,800 | $156,500 |
| 2021 | $4,613 | $256,300 | $99,800 | $156,500 |
| 2020 | $4,561 | $219,600 | $99,800 | $119,800 |
| 2019 | $4,561 | $219,600 | $99,800 | $119,800 |
| 2018 | $4,456 | $219,600 | $99,800 | $119,800 |
| 2017 | $4,184 | $182,400 | $85,600 | $96,800 |
| 2016 | $4,095 | $182,400 | $85,600 | $96,800 |
| 2015 | $4,095 | $182,400 | $85,600 | $96,800 |
| 2014 | $4,082 | $178,700 | $82,000 | $96,700 |
Source: Public Records
Map
Nearby Homes
- 20 Hilltop Dr
- 26 Ellison St
- 14 Amanda St
- 9 Tophill Cir
- 33 Rose Hill Dr
- 78 Wilbur Ave
- 20 Manilla Ave
- 15 Watkins Ave
- 200 Mayfield Ave Unit C8
- 50 Briarwood Rd
- 87 Lincoln Park Ave
- 52 Cottonwood Dr
- 309 East St
- 325 East St
- 10 East St Unit 316
- 339 East St
- 82 Mountain Laurel Dr
- 77 Valley View Dr
- 1027 Providence St Unit 4B
- 157 Sweetbriar Dr
- 53 Normandy Dr
- 63 Normandy Dr
- 49 Normandy Dr
- 86 Coolspring Dr
- 80 Coolspring Dr
- 69 Normandy Dr
- 58 Normandy Dr
- 43 Normandy Dr
- 94 Coolspring Dr
- 73 Normandy Dr
- 80 Normandy Dr
- 74 Coolspring Dr
- 106 Coolspring Dr
- 50 Normandy Dr
- 39 Normandy Dr
- 88 Old Spring Rd
- 92 Old Spring Rd
- 14 Capeway Rd
- 112 Coolspring Dr
- 80 Old Spring Rd
Your Personal Tour Guide
Ask me questions while you tour the home.