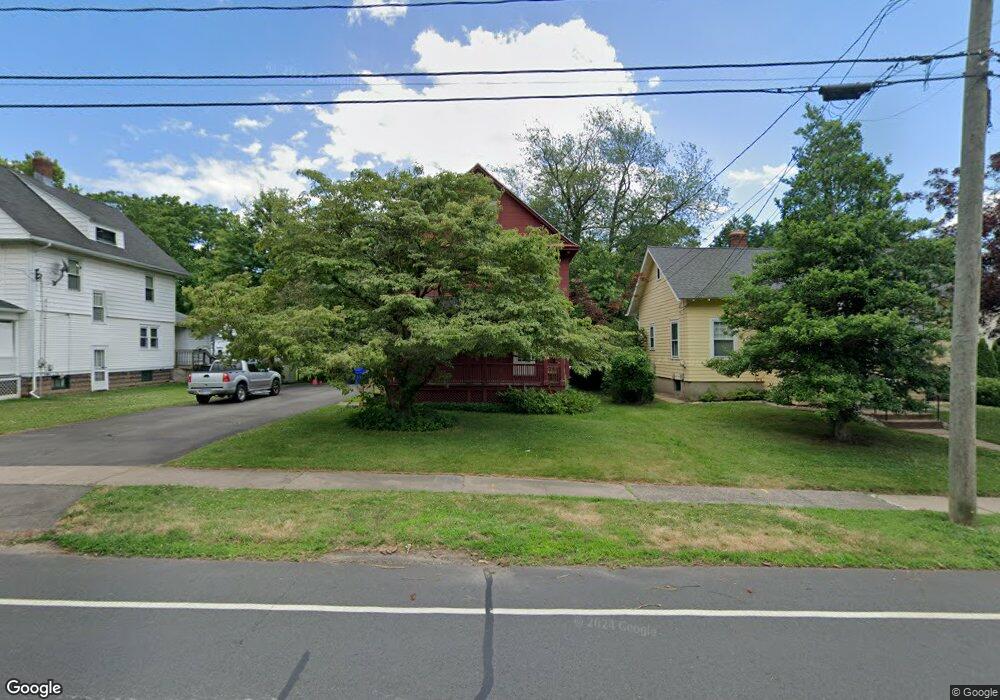
59 Nott St Wethersfield, CT 06109
Estimated Value: $282,000 - $407,000
3
Beds
2
Baths
1,482
Sq Ft
$246/Sq Ft
Est. Value
About This Home
This home is located at 59 Nott St, Wethersfield, CT 06109 and is currently estimated at $364,807, approximately $246 per square foot. 59 Nott St is a home located in Hartford County with nearby schools including Alfred W. Hanmer School, Silas Deane Middle School, and Wethersfield High School.
Ownership History
Date
Name
Owned For
Owner Type
Purchase Details
Closed on
Jul 19, 2024
Sold by
Farrelly Eileen
Bought by
Crowl Tyler and Crowl Monika
Current Estimated Value
Home Financials for this Owner
Home Financials are based on the most recent Mortgage that was taken out on this home.
Original Mortgage
$220,000
Outstanding Balance
$216,503
Interest Rate
6.87%
Mortgage Type
Purchase Money Mortgage
Estimated Equity
$148,304
Purchase Details
Closed on
Dec 9, 2022
Sold by
Farrelly Sharon S
Bought by
Farrelly Sharon S and Farrelly Eileen
Create a Home Valuation Report for This Property
The Home Valuation Report is an in-depth analysis detailing your home's value as well as a comparison with similar homes in the area
Home Values in the Area
Average Home Value in this Area
Purchase History
| Date | Buyer | Sale Price | Title Company |
|---|---|---|---|
| Crowl Tyler | $275,000 | None Available | |
| Crowl Tyler | $275,000 | None Available | |
| Farrelly Sharon S | -- | None Available | |
| Farrelly Sharon S | -- | None Available |
Source: Public Records
Mortgage History
| Date | Status | Borrower | Loan Amount |
|---|---|---|---|
| Open | Crowl Tyler | $220,000 | |
| Closed | Crowl Tyler | $220,000 |
Source: Public Records
Tax History
| Year | Tax Paid | Tax Assessment Tax Assessment Total Assessment is a certain percentage of the fair market value that is determined by local assessors to be the total taxable value of land and additions on the property. | Land | Improvement |
|---|---|---|---|---|
| 2025 | $10,538 | $255,650 | $133,560 | $122,090 |
| 2024 | $6,642 | $153,690 | $75,680 | $78,010 |
| 2023 | $6,421 | $153,690 | $75,680 | $78,010 |
| 2022 | $6,314 | $153,690 | $75,680 | $78,010 |
| 2021 | $6,251 | $153,690 | $75,680 | $78,010 |
| 2020 | $6,254 | $153,690 | $75,680 | $78,010 |
| 2019 | $6,261 | $153,690 | $75,680 | $78,010 |
| 2018 | $6,341 | $155,500 | $75,300 | $80,200 |
| 2017 | $6,184 | $155,500 | $75,300 | $80,200 |
| 2016 | $5,993 | $155,500 | $75,300 | $80,200 |
| 2015 | $5,939 | $155,500 | $75,300 | $80,200 |
| 2014 | $5,713 | $155,500 | $75,300 | $80,200 |
Source: Public Records
Map
Nearby Homes
- 317-319 Garden St
- 1 Fernwood St
- 23 Hillcrest Ave
- 18 Avalon Place
- 192 Wolcott Hill Rd
- 493 Main St
- 87 Somerset St
- 91 Somerset St
- 538 Main St
- 219-221 Jordan Ln
- 35 Stillwold Dr
- 704 Franklin Ave
- 108 Chamberlain Rd
- 28 Bolton St
- 131 Coleman Rd
- 90 Goodwin Park Rd
- 147 Spring St
- 19 Albert Ave
- 1 Bristol St
- 166 George St
Your Personal Tour Guide
Ask me questions while you tour the home.