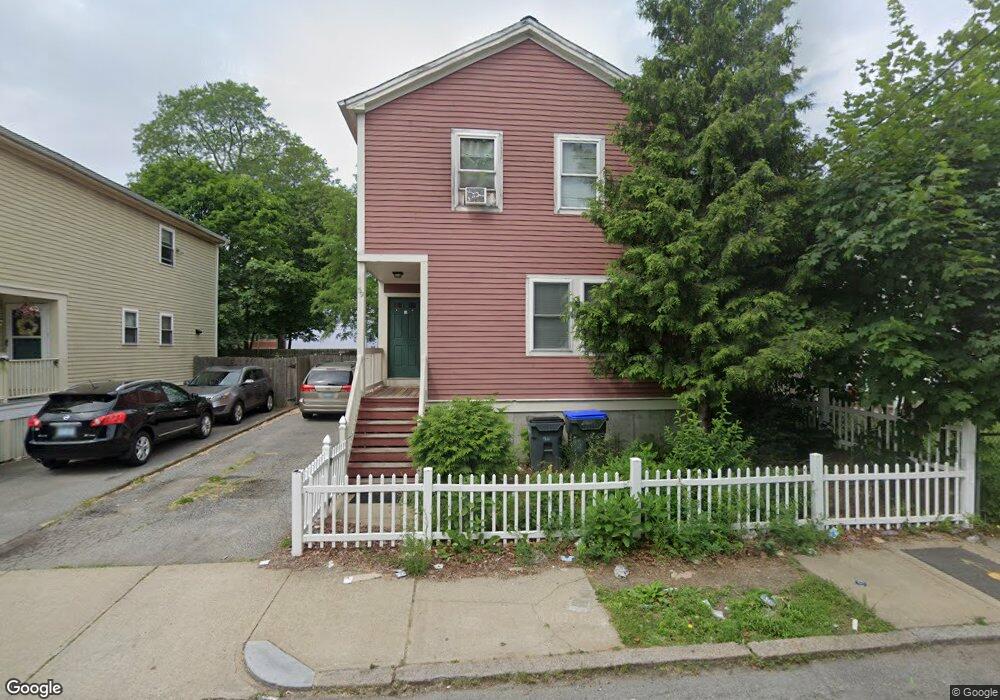
59 Ocean St Providence, RI 02905
Lower South Providence NeighborhoodEstimated Value: $369,000 - $480,000
4
Beds
2
Baths
1,548
Sq Ft
$275/Sq Ft
Est. Value
About This Home
This home is located at 59 Ocean St, Providence, RI 02905 and is currently estimated at $425,986, approximately $275 per square foot. 59 Ocean St is a home located in Providence County with nearby schools including The Hope Academy, SouthSide Elementary Charter, and Bishop Mcvinney Elementary School.
Ownership History
Date
Name
Owned For
Owner Type
Purchase Details
Closed on
Oct 31, 2007
Sold by
Swap Inc
Bought by
Ndayisaba Samy
Current Estimated Value
Home Financials for this Owner
Home Financials are based on the most recent Mortgage that was taken out on this home.
Original Mortgage
$133,050
Outstanding Balance
$82,856
Interest Rate
6.43%
Estimated Equity
$343,130
Create a Home Valuation Report for This Property
The Home Valuation Report is an in-depth analysis detailing your home's value as well as a comparison with similar homes in the area
Home Values in the Area
Average Home Value in this Area
Purchase History
| Date | Buyer | Sale Price | Title Company |
|---|---|---|---|
| Ndayisaba Samy | $183,000 | -- |
Source: Public Records
Mortgage History
| Date | Status | Borrower | Loan Amount |
|---|---|---|---|
| Open | Ndayisaba Samy | $133,050 | |
| Closed | Ndayisaba Samy | $27,450 |
Source: Public Records
Tax History
| Year | Tax Paid | Tax Assessment Tax Assessment Total Assessment is a certain percentage of the fair market value that is determined by local assessors to be the total taxable value of land and additions on the property. | Land | Improvement |
|---|---|---|---|---|
| 2025 | $3,233 | $384,900 | $119,700 | $265,200 |
| 2024 | $5,325 | $290,200 | $75,800 | $214,400 |
| 2023 | $5,325 | $290,200 | $75,800 | $214,400 |
| 2022 | $5,166 | $290,200 | $75,800 | $214,400 |
| 2021 | $4,797 | $195,300 | $33,500 | $161,800 |
| 2020 | $4,797 | $195,300 | $33,500 | $161,800 |
| 2019 | $4,797 | $195,300 | $33,500 | $161,800 |
| 2018 | $4,439 | $138,900 | $30,400 | $108,500 |
| 2017 | $4,439 | $138,900 | $30,400 | $108,500 |
| 2016 | $4,439 | $138,900 | $30,400 | $108,500 |
| 2015 | $4,521 | $136,600 | $30,400 | $106,200 |
| 2014 | $4,610 | $136,600 | $30,400 | $106,200 |
| 2013 | $4,610 | $136,600 | $30,400 | $106,200 |
Source: Public Records
Map
Nearby Homes
- 61 Ocean St
- 124 Potters Ave Unit 124
- 128 Potters Ave Unit 2
- 128 Potters Ave Unit 1
- 60 Burnside St
- 67 Ocean St
- 54 Burnside St
- 50 Burnside St
- 50 Burnside St Unit 3
- 50 Burnside St Unit 2
- 56 Ocean St
- 64 Ocean St
- 73 Ocean St
- 118 Potters Ave
- 52 Burnside St Unit 2
- 75 Ocean St
- 70 Ocean St
- 45 Ocean St
- 129 Potters Ave
- 76 Ocean St
Your Personal Tour Guide
Ask me questions while you tour the home.