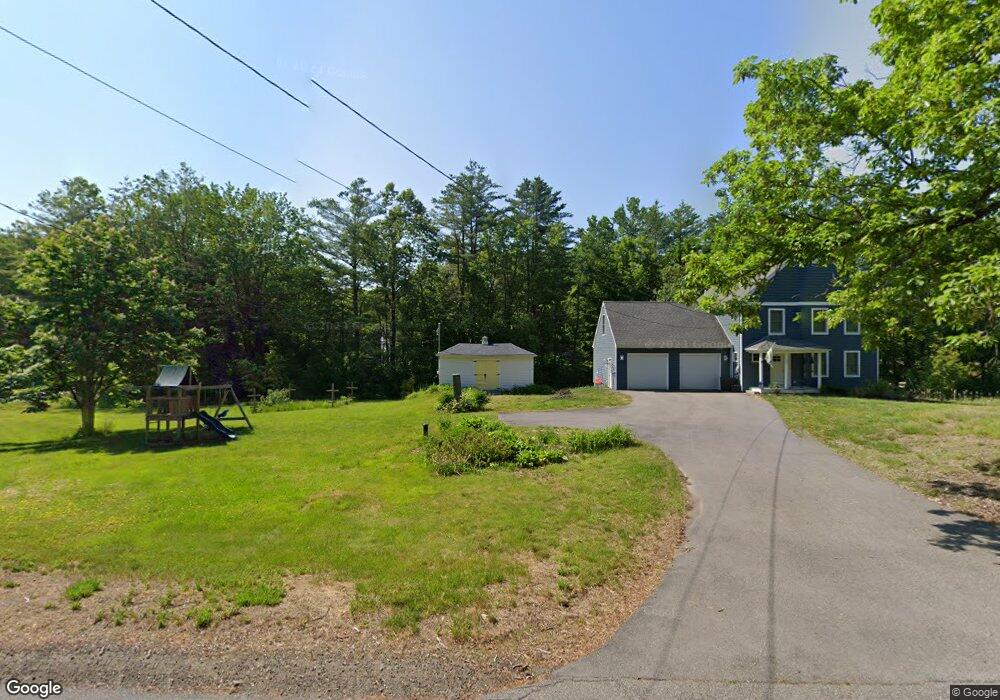
59 Old Rd S South Berwick, ME 03908
Estimated Value: $585,000 - $687,000
4
Beds
3
Baths
2,080
Sq Ft
$308/Sq Ft
Est. Value
About This Home
This home is located at 59 Old Rd S, South Berwick, ME 03908 and is currently estimated at $639,685, approximately $307 per square foot. 59 Old Rd S is a home located in York County with nearby schools including Marshwood High School, Berwick Academy, and Seacoast Christian School.
Ownership History
Date
Name
Owned For
Owner Type
Purchase Details
Closed on
Sep 22, 2020
Sold by
Williamson Kathleen and Tanguay Real C
Bought by
Tanguay Brian M and Tanguay Margaux M
Current Estimated Value
Home Financials for this Owner
Home Financials are based on the most recent Mortgage that was taken out on this home.
Original Mortgage
$385,700
Outstanding Balance
$340,725
Interest Rate
2.9%
Mortgage Type
New Conventional
Estimated Equity
$298,960
Purchase Details
Closed on
Apr 25, 2018
Sold by
Corliss Properties Inc
Bought by
Williamson Kathleen and Tanguay Real C
Home Financials for this Owner
Home Financials are based on the most recent Mortgage that was taken out on this home.
Original Mortgage
$307,760
Interest Rate
4.44%
Mortgage Type
New Conventional
Create a Home Valuation Report for This Property
The Home Valuation Report is an in-depth analysis detailing your home's value as well as a comparison with similar homes in the area
Home Values in the Area
Average Home Value in this Area
Purchase History
| Date | Buyer | Sale Price | Title Company |
|---|---|---|---|
| Tanguay Brian M | -- | None Available | |
| Tanguay Brian M | -- | None Available | |
| Tanguay Brian M | -- | None Available | |
| Tanguay Brian M | -- | None Available | |
| Williamson Kathleen | -- | -- | |
| Corliss Properties Inc | -- | -- | |
| Williamson Kathleen | -- | -- | |
| Corliss Properties Inc | -- | -- |
Source: Public Records
Mortgage History
| Date | Status | Borrower | Loan Amount |
|---|---|---|---|
| Open | Tanguay Brian M | $385,700 | |
| Closed | Tanguay Brian M | $385,700 | |
| Previous Owner | Corliss Properties Inc | $307,760 |
Source: Public Records
Tax History Compared to Growth
Tax History
| Year | Tax Paid | Tax Assessment Tax Assessment Total Assessment is a certain percentage of the fair market value that is determined by local assessors to be the total taxable value of land and additions on the property. | Land | Improvement |
|---|---|---|---|---|
| 2024 | $7,508 | $559,500 | $174,100 | $385,400 |
| 2023 | $6,923 | $495,900 | $152,400 | $343,500 |
| 2022 | $6,148 | $422,800 | $145,100 | $277,700 |
| 2021 | $5,944 | $382,500 | $145,100 | $237,400 |
| 2020 | $6,094 | $348,200 | $128,400 | $219,800 |
| 2019 | $6,097 | $324,300 | $116,800 | $207,500 |
| 2018 | $3,540 | $285,700 | $116,300 | $169,400 |
| 2017 | $1,566 | $82,400 | $79,800 | $2,600 |
| 2016 | $1,508 | $82,400 | $79,800 | $2,600 |
| 2015 | $1,467 | $82,400 | $79,800 | $2,600 |
| 2014 | $2,136 | $120,700 | $118,100 | $2,600 |
Source: Public Records
Map
Nearby Homes