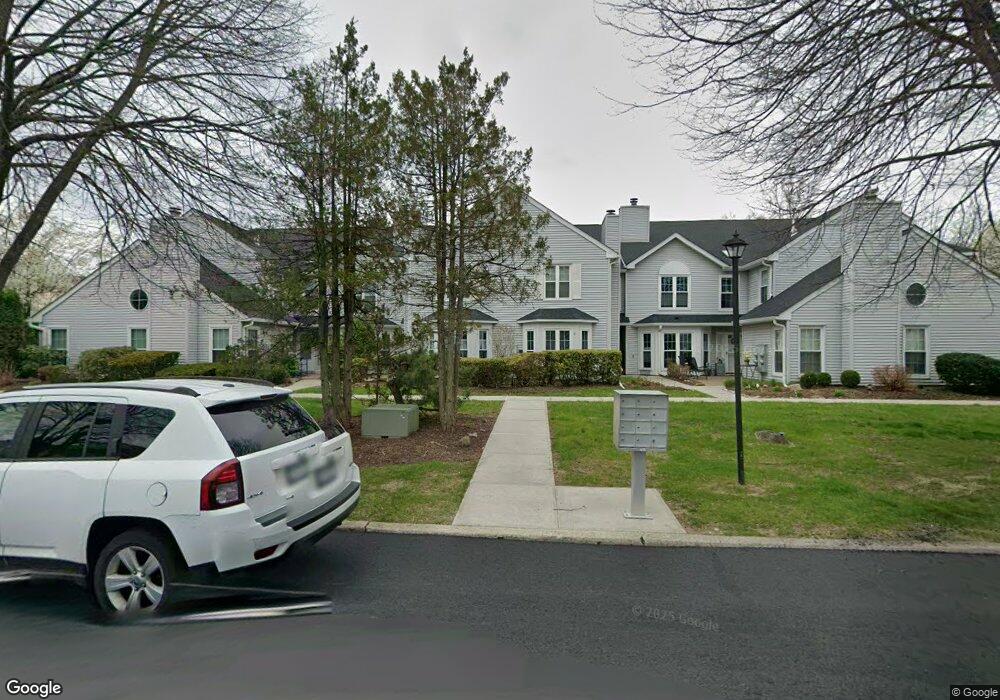
59 Olde Wagon Rd Warwick, NY 10990
Estimated Value: $426,000 - $485,000
3
Beds
3
Baths
1,491
Sq Ft
$302/Sq Ft
Est. Value
About This Home
This home is located at 59 Olde Wagon Rd, Warwick, NY 10990 and is currently estimated at $449,705, approximately $301 per square foot. 59 Olde Wagon Rd is a home located in Orange County with nearby schools including Warwick Valley Middle School and Warwick Valley High School.
Ownership History
Date
Name
Owned For
Owner Type
Purchase Details
Closed on
Jun 16, 2022
Sold by
Singh Kuldip and Galaydick Jodi
Bought by
Singh Galaydick Lt and Singh
Current Estimated Value
Purchase Details
Closed on
Jun 10, 2021
Sold by
Bigg Cairn Llc
Bought by
Galaydick Jodi and Singh Kuldip
Home Financials for this Owner
Home Financials are based on the most recent Mortgage that was taken out on this home.
Original Mortgage
$332,500
Interest Rate
2.9%
Mortgage Type
Stand Alone Refi Refinance Of Original Loan
Purchase Details
Closed on
Apr 24, 2018
Sold by
Rappa Charles V and Rappa Carolyn E
Bought by
Bigg-Cairn Llc
Purchase Details
Closed on
Nov 7, 2000
Sold by
Degloria Ellen
Bought by
Rappa Charles and Rappa Carolyn E
Create a Home Valuation Report for This Property
The Home Valuation Report is an in-depth analysis detailing your home's value as well as a comparison with similar homes in the area
Home Values in the Area
Average Home Value in this Area
Purchase History
| Date | Buyer | Sale Price | Title Company |
|---|---|---|---|
| Singh Galaydick Lt | -- | None Available | |
| Singh Galaydick Lt | -- | None Available | |
| Singh Galaydick Lt | -- | None Available | |
| Galaydick Jodi | $350,000 | None Available | |
| Galaydick Jodi | $350,000 | None Available | |
| Galaydick Jodi | $350,000 | None Available | |
| Bigg-Cairn Llc | $265,000 | -- | |
| Rappa Charles | $166,500 | -- | |
| Rappa Charles V | $166,500 | -- |
Source: Public Records
Mortgage History
| Date | Status | Borrower | Loan Amount |
|---|---|---|---|
| Previous Owner | Galaydick Jodi | $332,500 |
Source: Public Records
Tax History
| Year | Tax Paid | Tax Assessment Tax Assessment Total Assessment is a certain percentage of the fair market value that is determined by local assessors to be the total taxable value of land and additions on the property. | Land | Improvement |
|---|---|---|---|---|
| 2024 | $4,868 | $17,200 | $4,400 | $12,800 |
| 2023 | $4,797 | $17,200 | $4,400 | $12,800 |
| 2022 | $4,686 | $17,200 | $4,400 | $12,800 |
| 2021 | $4,710 | $17,200 | $4,400 | $12,800 |
| 2020 | $4,803 | $17,200 | $4,400 | $12,800 |
| 2019 | $4,509 | $17,200 | $4,400 | $12,800 |
| 2018 | $4,509 | $17,200 | $4,400 | $12,800 |
| 2017 | $1,705 | $17,200 | $4,400 | $12,800 |
| 2016 | $1,682 | $17,200 | $4,400 | $12,800 |
| 2015 | -- | $17,200 | $4,400 | $12,800 |
| 2014 | -- | $17,200 | $4,400 | $12,800 |
Source: Public Records
Map
Nearby Homes
- 60 the Rise Unit 99
- 23 Candlestick Ct
- 15 Cowdrey St
- 1579 New York 17a
- 15 Cropsey St Unit 15-3A
- 17 Cropsey St Unit 1D
- 2 Sly St
- 96 Galloway Rd
- 56 Ball Rd
- 101 Upper Wisner Rd
- 48 Ball Rd
- 63 Colonial Ave
- 0 Brady Rd Unit KEY898171
- 42 Colonial Ave
- 26 High St
- 1513 New York 17a
- 28 Brady Rd
- 49 Maple Ave
- 11 Hilltop Ln
- 10 Howe St
- 71 Olde Wagon Rd
- 69 Olde Wagon Rd
- 57 Olde Wagon Rd
- 67 Olde Wagon Rd
- 55 Olde Wagon Rd Unit 607
- 65 Olde Wagon Rd
- 63 Olde Wagon Rd
- 51 Olde Wagon Rd
- 61 Olde Wagon Rd
- 16 Olde Wagon Rd
- 45 Olde Wagon Rd
- 47 Olde Wagon Rd
- 64 Homestead Village Dr
- 42 Homestead Village Dr
- 48 Homestead Village Dr
- 50 Homestead Village Dr
- 52 Homestead Village Dr
- 58 Homestead Village Dr
- 62 Homestead Village Dr
- 64 Homestead Village Dr
Your Personal Tour Guide
Ask me questions while you tour the home.