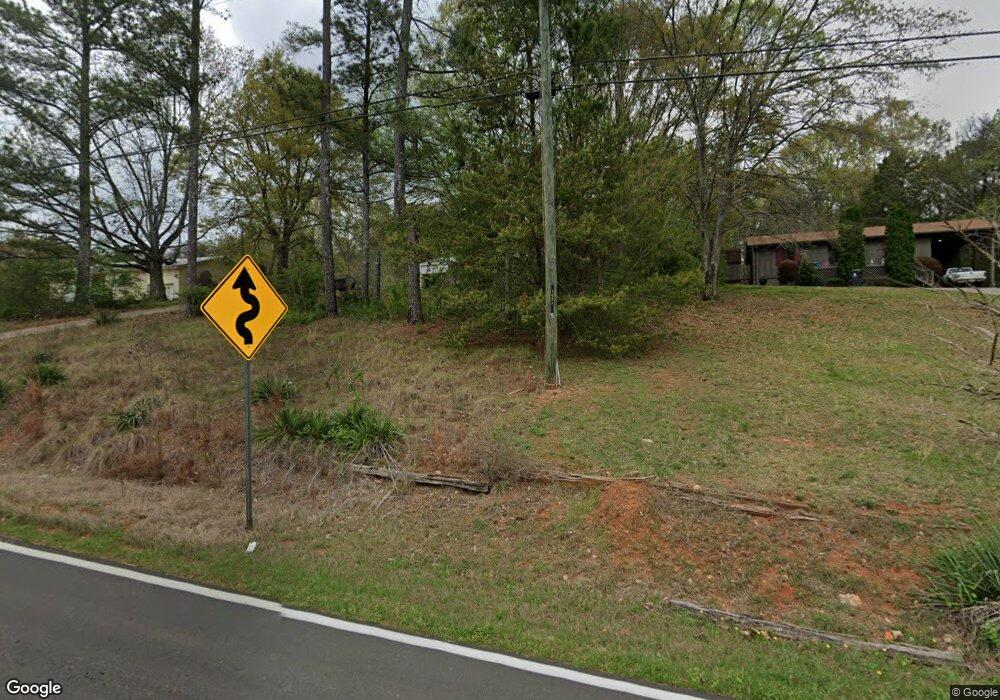
59 Padlock Mountain Rd SW Cave Spring, GA 30124
Estimated Value: $163,257 - $193,000
Studio
--
Bath
1,124
Sq Ft
$160/Sq Ft
Est. Value
About This Home
This home is located at 59 Padlock Mountain Rd SW, Cave Spring, GA 30124 and is currently estimated at $180,314, approximately $160 per square foot. 59 Padlock Mountain Rd SW is a home located in Floyd County with nearby schools including Coosa Middle School and Coosa High School.
Ownership History
Date
Name
Owned For
Owner Type
Purchase Details
Closed on
Jul 8, 2009
Sold by
Federal National Mortgage Association
Bought by
Ford Mike K
Current Estimated Value
Purchase Details
Closed on
Feb 3, 2009
Sold by
Le Ben
Bought by
Litton Loan Servicing Lp
Purchase Details
Closed on
Jul 20, 1999
Sold by
Brackett Barbara C
Bought by
Le Ben
Purchase Details
Closed on
Jan 7, 1991
Sold by
Brackett Christopher K
Bought by
Brackett Barbara C
Purchase Details
Closed on
Mar 10, 1989
Sold by
Farmers Home Administration
Bought by
Brackett Christopher K
Purchase Details
Closed on
Jun 17, 1985
Sold by
Watson Thomas J and Watson Bonnie J
Bought by
Farmers Home Administration
Purchase Details
Closed on
Feb 10, 1982
Sold by
Brewer C Jack
Bought by
Watson Thomas J and Watson Bonnie J
Purchase Details
Closed on
Sep 21, 1981
Bought by
Brewer C Jack
Create a Home Valuation Report for This Property
The Home Valuation Report is an in-depth analysis detailing your home's value as well as a comparison with similar homes in the area
Purchase History
| Date | Buyer | Sale Price | Title Company |
|---|---|---|---|
| Ford Mike K | -- | -- | |
| Litton Loan Servicing Lp | $67,400 | -- | |
| Le Ben | $45,500 | -- | |
| Brackett Barbara C | -- | -- | |
| Brackett Christopher K | $27,400 | -- | |
| Farmers Home Administration | -- | -- | |
| Watson Thomas J | $3,800 | -- | |
| Brewer C Jack | -- | -- |
Source: Public Records
Tax History
| Year | Tax Paid | Tax Assessment Tax Assessment Total Assessment is a certain percentage of the fair market value that is determined by local assessors to be the total taxable value of land and additions on the property. | Land | Improvement |
|---|---|---|---|---|
| 2025 | $1,175 | $44,601 | $6,603 | $37,998 |
| 2024 | $1,175 | $41,299 | $5,870 | $35,429 |
| 2023 | $1,086 | $40,005 | $5,336 | $34,669 |
| 2022 | $873 | $31,909 | $4,361 | $27,548 |
| 2021 | $783 | $28,082 | $3,976 | $24,106 |
| 2020 | $747 | $26,569 | $3,457 | $23,112 |
| 2019 | $709 | $25,558 | $3,457 | $22,101 |
| 2018 | $676 | $24,316 | $3,293 | $21,023 |
| 2017 | $656 | $23,546 | $3,049 | $20,497 |
| 2016 | $656 | $23,272 | $3,040 | $20,232 |
| 2015 | $640 | $23,272 | $3,040 | $20,232 |
| 2014 | $640 | $23,272 | $3,040 | $20,232 |
Source: Public Records
Map
Nearby Homes
- 38 Alabama St
- 0 Mill St SW Unit 11671446
- 57 Mill St
- 0 Mill Rd Unit 10629874
- 0 Mill Rd Unit 7670319
- 5598 Fosters Mill Rd
- 700 Gadsden Rd SW
- 475 Davis Rd SW
- 0 Melson Rd SW Unit 7676052
- 0 Melson Rd SW Unit 10636997
- 914 Chubbtown Rd
- 907 Gadsden Rd SW
- 612 Michael Blvd
- 7112 C Blacks Bluff Rd
- 0 Santa Claus Rd Unit 7735787
- 0 Santa Claus Rd Unit 7706526
- 0 Santa Claus Rd Unit 10676218
- 387 Michael Blvd
- 75 Weaver Rd
- 425 Chubbtown Rd
- 57 Padlock Mountain Rd SW
- 61 Padlock Mountain Rd SW
- 55 Padlock Mountain Rd SW
- 63 Padlock Mountain Rd SW
- 120 Lyons Bridge Rd SW
- 53 Padlock Mountain Rd SW
- 65 Padlock Mountain Rd SW
- 51 Padlock Mountain Rd SW
- 1 Padlock Mountain Rd SW
- 4 Ridge Rd SW
- 4 Ridge Rd SW
- 4 Ridge Rd SW
- 61 Ridge Rd SW Unit 2
- 8 Ridge Rd SW Unit 23
- 130-C D Lyons Bridge Rd
- 7 Ridge Rd SW
- 10 Ridge Rd SW
- 128 Padlock Mountain Rd SW Unit A & B
- 128 Padlock Mountain Rd SW
- 130-A B Lyons Bridge Rd
Your Personal Tour Guide
Ask me questions while you tour the home.