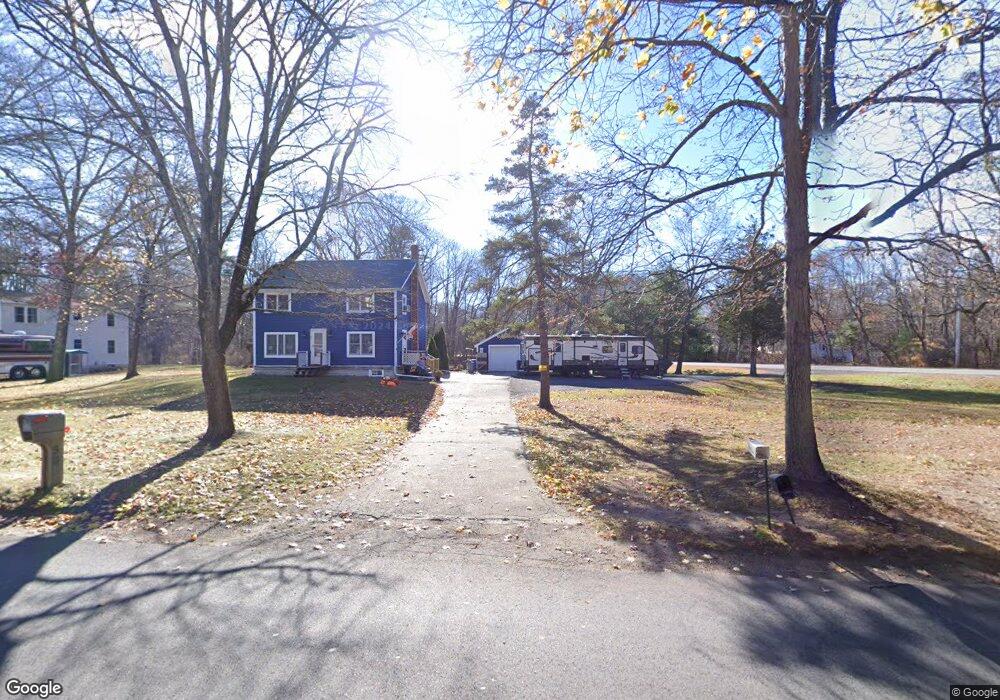
59 Pike St Salisbury, MA 01952
Estimated Value: $376,000 - $599,000
4
Beds
2
Baths
1,456
Sq Ft
$345/Sq Ft
Est. Value
About This Home
This home is located at 59 Pike St, Salisbury, MA 01952 and is currently estimated at $501,761, approximately $344 per square foot. 59 Pike St is a home located in Essex County with nearby schools including Triton Regional High School.
Ownership History
Date
Name
Owned For
Owner Type
Purchase Details
Closed on
Jun 17, 2008
Sold by
Merritt Jewel A and Merritt Michael W
Bought by
Merritt Michael W
Current Estimated Value
Purchase Details
Closed on
Nov 9, 1994
Sold by
Felch Howard R
Bought by
Merritt Michael W and Merritt Jewell A
Create a Home Valuation Report for This Property
The Home Valuation Report is an in-depth analysis detailing your home's value as well as a comparison with similar homes in the area
Home Values in the Area
Average Home Value in this Area
Purchase History
| Date | Buyer | Sale Price | Title Company |
|---|---|---|---|
| Merritt Michael W | -- | -- | |
| Merritt Michael W | $88,500 | -- |
Source: Public Records
Mortgage History
| Date | Status | Borrower | Loan Amount |
|---|---|---|---|
| Open | Merritt Michael W | $235,042 | |
| Previous Owner | Merritt Michael W | $215,000 | |
| Previous Owner | Merritt Michael W | $50,000 |
Source: Public Records
Tax History
| Year | Tax Paid | Tax Assessment Tax Assessment Total Assessment is a certain percentage of the fair market value that is determined by local assessors to be the total taxable value of land and additions on the property. | Land | Improvement |
|---|---|---|---|---|
| 2025 | $3,886 | $385,500 | $167,400 | $218,100 |
| 2024 | $3,912 | $374,400 | $167,400 | $207,000 |
| 2023 | $3,835 | $355,100 | $167,400 | $187,700 |
| 2022 | $3,697 | $331,900 | $150,700 | $181,200 |
| 2021 | $3,574 | $317,400 | $150,700 | $166,700 |
| 2020 | $3,382 | $295,100 | $150,700 | $144,400 |
| 2019 | $3,345 | $282,000 | $146,500 | $135,500 |
| 2018 | $3,145 | $267,000 | $137,400 | $129,600 |
| 2017 | $2,918 | $244,800 | $125,600 | $119,200 |
| 2016 | $2,748 | $235,500 | $121,400 | $114,100 |
| 2015 | $2,786 | $237,100 | $113,000 | $124,100 |
Source: Public Records
Map
Nearby Homes
Your Personal Tour Guide
Ask me questions while you tour the home.